Tuesday, July 28, 2015

Pursuit of Happiness

I am I in heaven 
or am in Miami?
    -Martin Mull

Castles made of sand
fall into the sea
eventually
   -Jim Hendrix


Greetings

             I started a new book today.  Its called "The Growth Fetish" by  Clive Hamilton.   He makes a number of interesting points.  One is that , the 21st century is different form all past history, in that now it is almost universally agreed that the pursuit of happiness is the same as the pursuit of money, and as DD puts it "driving around and buying shit."     Likewise it is universally accepted that the main purpose of government is to assure the growth of the economy, to enable the citizens to continue to make and spend money

   We hold these truths to be self evident.

       In years past, people had very different ideas about the happiness, the good life, and what one should strive for.  Various religious, philosophical  or political ideas held more sway..  But by and large, now, secular, sacred, capitalist or communist, the  mantra is the same "Show me the growth!"   

    Bearing that in mind, let's take a look at James Hanson's new paper here. (Robert Marston, does a great job of explaining the paper piece by piece here).  It has some interesting things to say about glacial melt, and sea rise, but for now, I want to look at the prescription.  Hanson says

"The task of achieving a reduction of atmospheric CO2 is formidable, but not impossible. Rapid transition to abundant aff ordable carbon-free electricity is the core requirement, as that would also permit production of net-zero-carbon liquid fuels from electricity. The rate at which CO2 emissions must be reduced is about 6%yr􀀀1 to reach 350 ppm atmospheric 5 CO2 by about 2100"

      Six percent does seem ambitious, but the US has actually been reducing its CO2 emissions lately, so perhaps it is achievable.   Which brings us to another paper  Drivers of the US CO2 emissions 2007 -2013.  Between 2007 and 2013, CO2 emissions declined by 11%.   This is good news!  All we need to do is figure out how we did it, and do more!   Unfortunately is clearly wasn't the increase in the construction of solar and wind facilities.  Even though that sector has grown  in absolute terms, when considered as a percentage of electrical generation is has remained stubboroly at 13% for over 10 years.   So what accounts for the decline in CO2?  One of the leuse of reduction was the recession. As the authors state:

   "Before 2007, rising emissions were primarily driven by economic growth. After 2007, decreasing emissions were largely a result of economic recession with changes in fuel mix (for example, substitution of natural gas for coal) playing a comparatively minor role. "

            As I read the study, the factors which had the most influence on the drop in emissions were  first the recession which reduced consumption, the off shoring of manufacturing, which reduced the "energy intensity of the GNP, and higher gas prices, which reduced driving around.   This  is hardly a platform any (sane)   politician can run on.  We must have growth!

      The authors conclude

     " Sustaining economic growth while also drastically reducing emissions to the levels targeted by the Obama administration27 will depend upon large additional decreases in the energy intensity of the US economy as well as radical decarbonization of the energy sector (that is, very large changes in the fuel mix of the energy sector away from fossil fuels and toward renewables and/or nuclear energy)." 

    Happily at least one presidential hopeful, Hillary Clinton, has called for "radical decarbinization" of the economy, by proposing a 700% increase in solar power over the next 15 years, to bring the percent of electricity produced by renewables  up from 13% to 33%.  see here for an analysis by Bra d Plummer at Vox.  Fossil fueled electric plants now provide 68% .  This proposal would reduce them to 48% in 15 years.   Using my limited math skills, this appears closer to a 2% reduction per year than 6%. 

    So, we come back to Miami, which is already experiencing the effects of the rising sea.  They aren't worried about several meters, or one meter.  One foot would be a problem.    According tomscientists at the University of Miami, the local sea rise is accelerating.     see here 

   "In low-lying Florida, the culprit is the rising sea level. Should the ocean crawl just one more foot up the edges of this peninsula – something that’s projected to happen in the next two decades, by some estimates – most of the canal systems that keep the saltwater out of the area’s drinking wells would cease to function. A few more feet, and entire towns suddenly turn neo-Venetian, the roads flooded, the infrastructure almost impossible to salvage."  from here

Labels: , , ,

Friday, August 22, 2014

Greenland and Antarctic maps reveal “unprecedented” ice loss


Cold as ice
Someday you'll pay the price
    - Foreigner

I have lived here before, the days of ice,
And of course this is why I'm so concerned,
And I come back to find the stars misplaced
and the smell of a world that has burned.

      -Jim Hendrix

Greetings

      Interesting goings on up in Greenland.  Ice is  melting.   (see below from Carbon Brief) This, of course is somewhat concerning, as it will "eventually" result in a problematic sea rise.

    As usual with climate science, this recent melting is proceeding "faster than anticipated".  And it seems to be accelerating.  As reported by Robert Scribbler

   "It was an extraordinary rate of melt now 4.7 times faster than in the period from 1997 to 2003 and 2.5 times faster than during 2003 to 2009. But, likely, it is but one more milestone on the path to even faster melt."
    
     What does this mean?


   Perhaps its useful to look at at the geologic record .  Here's a summary from a new report from David Spratt, author of Climate Code Red

  • "During mid-Miocene climatic optimum  [16-14 million years ago] CO2 levels were similar to today, but temperatures were ~3–6C warmer and sea levels 25 to 40 metres higher than at present… When CO2 levels were last similar to modern values (greater than 350 ppmv to 400 pmv), there was little glacial ice on land, or sea ice in the Arctic, and a marine-based ice mass on Antarctica was not viable… Lower levels were necessary for the growth of large ice mass on West Antarctica (~250 to 300 ppmv) and Greenland (~220 to 260 ppmv)" (Tripati, Roberts et al., 2009).
  • “We estimate sea level for the Middle Pliocene epoch [3.0–3.5 million years ago] – a period with near-modern CO2 levels – at 25±5 metres above present, which is validated by independent sea-level data” (Rohling, Grant et al., 2009).
  • Likewise, “during the middle-Pliocene … we find sea level fluctuations of 20-40 metres associated with global temperature variations between today’s temperature and +3°C” (Hansen, Sato et al., 2013).

 
   But of course, humans,  being creatures with hyperbolic discount rate, we aren't that concerned about events that might happen at the end of the century, but do worry about things in our lifetime.   Our first question is ; When?

     It seems the future is coming at us at an accelerating rate.   Back to Robert:

"It is likely that mass rate losses will continue to increase until some kind of break or negative feedback comes into play. Similar rates of melt increase would mean an annual 5-8 millimeter sea level rise by 2035 due to Greenland and Antarctic melt on top of a 2-3 millimeter sea level rise from thermal expansion of the oceans and from other melt sources. But even taking into account the cooling effect at the ocean surface from ice melt and fresh water floods, one could easily envision the feared 1-3 foot sea level rise by sometime near mid century and the even more concerning 3-9 foot sea level rise amidst a very intense battle between hot and cold weather systems through to century’s end."


Fun facts about sea level rise from here:

• Thirteen of the world’s 20 largest cities are now located on a coast.
• Nearly 25% of the world’s population lives within 62 miles (100 kilometers) of a shoreline, and this figure is likely to increase to 50% over the next 25 years as people flock to coastal cities.
• More than 600 million people live in coastal regions that are less than 10 meters above sea level.
• Two-thirds of the world’s cities have populations of five million or more living in at-risk areas that are less than 10 meter above sea level. (Source)
• Thirteen of the world’s fifteen largest cities are on coastal plains. Many smaller cities, such as Alexandria, Egypt’s ancient center of learning, also face a severe risk of inundation with a 39-inch (1m) rise in sea level. 
• Low-lying coastal regions in developing countries such as Bangladesh, Vietnam, India, and China have especially large populations living in at-risk coastal areas such as deltas, where river systems enter the ocean. Both large island nations such as the Philippines and Indonesia and small ones such as Tuvalu and Vanuatu are at severe risk because they do not have enough land at higher elevations to support displaced coastal populations.
• Some island nations risk the danger of losing their fresh-water supplies as sea level rise pushes saltwater into their aquifers. For these reasons, those living on several small island nations (including the Maldives in the Indian Ocean and the Marshall Islands in the Pacific) could be forced to evacuate over the 21st century. (Source)
• With sea level projected to rise at an accelerated rate for at least several centuries, very large numbers of people in vulnerable locations are going to be forced to relocate. If relocation is delayed or populations do not evacuate during times when the areas are inundated by storm surges, very large numbers of environmental refugees are likely to result. (Source)

For visual representation of such a rise see here.    

-------

Greenland and Antarctic maps reveal “unprecedented” ice loss


A series of maps published this week show Greenland and Antarctica are losing more ice than at any time since satellite records began.
Scientists found the two vast ice sheets are losing a total of 500 cubic kilometers of ice per year, contributing to rising global sea levels.
Ice loss
The researchers used data from the European Space Agency's CryoSat - a satellite that passes over the earth at 700 kilometers above the surface and measures the thickness of polar ice.
The satellite was launched in 2010 and has been collecting data on sea ice and ice sheets ever since. By comparing data with other satellite missions, scientists can see how quickly the ice sheets are changing.
The study, just published in the journal The Cryosphere, reveals that since 2009, the volume of ice loss has tripled in West Antarctica and more than doubled in Greenland. This is the highest rate of ice loss since satellite records began 20 years ago.
Regional differences
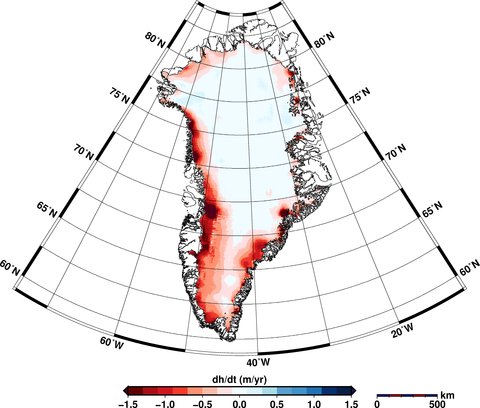
The maps show that Greenland is losing around three times more ice than Antarctica, including thinning of the entire western ice sheet and further losses in the southeast and northwest ice sheets. You can see where the greatest losses of ice are occurring in the red areas in the maps below.
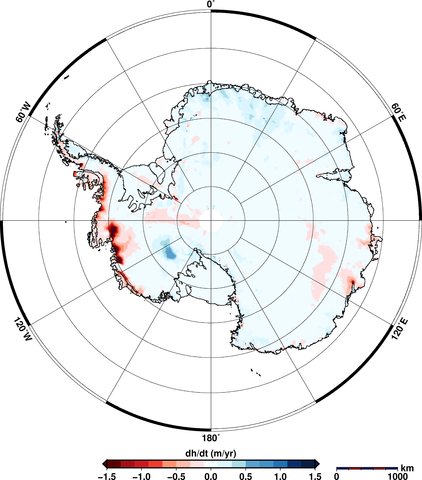
In Antarctica, the maps show thinning of the West Antarctic Ice Sheet and the Peninsula. East Antarctica shows some increases in thickness (shown in blue in the maps), though this doesn't outweigh the losses elsewhere. Overall, more ice is being lost than gained.
The Cryosphere _Greenland Elevation Change _Aug 14

The Cryosphere _Antarctic Elevation Change _Aug 14
Elevation changes in Greenland (top) and Antarctica (bottom) between January 2011 to January 2014. Areas in red show loss of ice; blue shows gains. Source: V. Helm et al.(2014)
Satellite measurements
CryoSat collects data at 200 million points in Antarctica and 14.3 million in Greenland, as aBBC article today notes. Satellites can measure ice sheet heights by firing a radar pulse at each point and recording the time it takes for the signal to bounce back.
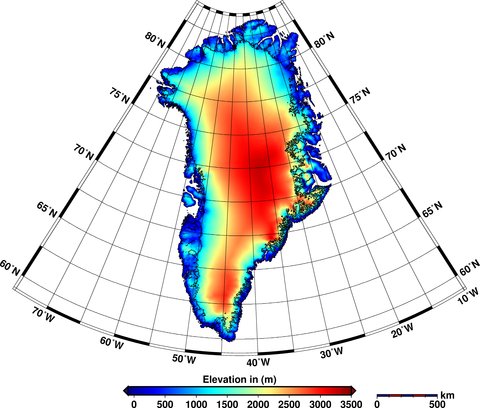
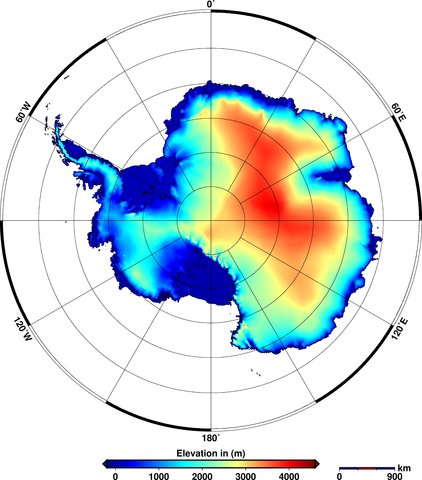
The data is used to create digital elevation models that provide a 'snapshot' of the state of the ice sheets covering the two land masses. You can see how the ice thickness varies over the surface of the earth in the figures below. The areas in red show thicker ice towards the middle of the land mass and the blue areas show the thinner ice around the edges.
The Cryosphere _Greenland Elevation _Aug 14

The Cryosphere _Antarctic Elevation _Aug 14
Elevations of ice in Greenland (top) and Antarctica (bottom) in 2012. Red shows areas of thicker ice; blue shows thinner ice. Source: V. Helm et al. (2014)
New imagery
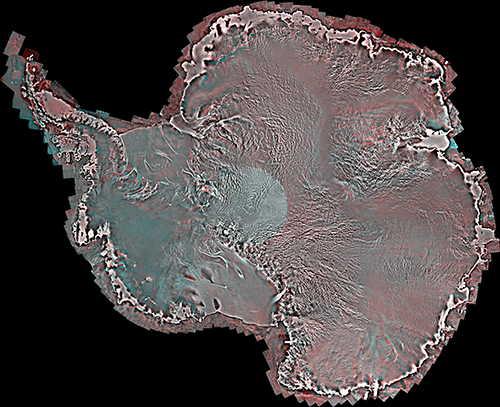
These aren't the only new satellite images to be released this week. A Canadian collaboration, including the University of Waterloo and the Canadian Space Agency, released a satellite 'mosaic' image of the whole of Antarctica.
The image, shown below, is made up from over 3,000 satellite images taken in 2008.
Uni Of Waterloo _Antarctica Image _Aug 14
Mosaic satellite image of Antarctica. Source: University of Waterloo
Yesterday's Mail Online covered the new research, featuring some of the satellite's images - such as the one above - including a close-up of an individual ice shelf.
The team behind the image also produced an equivalent version from images taken in 1997 and hope that being able to compare the two could help scientists identify changes in the ice sheets over Antarctica.
The next steps for the team include providing more regular updates to the Antarctic image, and creating a similar mosaic image for Greenland.

V. Helm, A. Humbert, and H. Miller (2014) Elevation and elevation change of Greenland and Antarctica derived from CryoSat-2, The Cryosphere, doi:10.5194/tc-8-1539-2014

Labels: , , , , , ,