Friday, May 30, 2014

We are DEVO


Four car garage 
and we're still building on
  -Willie and Waylon  (Lukenbach Texas)

Coming down
 is the hardest thing
 -Tom Petty


Greetings


       Now that the EIA has popped our bubble on the miracle of fracking in California,  maybe its time to look at what things might look like in a world of falling oil production.
 
      At first, of course, we'll just let the price rise, and scream about environmentalists interfering with drilling.

     But at some point we'll start to think about the "R" word.  That's right: "rationing".  Under rationing , we first make sure the essential stuff is covered, then parcel out the rest..  So you and I "driving around buying stuff"  are last in line. ( For instance, during WW2 we would get 3- 4 gallons per week.)  Here's a summary of the 1980 rationing plan

      And then?

      Here's a nice speculative piece by Alice Freidman.  She has a blog called Energy Skeptic.  Its a regular encyclopedia of stuff about resources.  Here's an interview with her on the Kunstler cast.

      Anyway, she takes a look at the total transportation picture, then backs out the "non essential" and allocates that oil to the "essentials".  (Under this scenario, we get 0 gallons a week,)  Then she tries to figure the decline rate, and see's where the total equals the "essentials".  Using her assumptions, oil production. takes a serious dive, and  is equal to the amount needed for essential use in 16 years!

     Your numbers may vary!    But I think its a worth while exercise.     Her decline number seem severe  (4/5/6/7/8/9/10/10 /10/)   , but  the rate incorporates a combination of effects  First is the normal decline rate:  Estimates for this run between 4.5% (CERA)  to 6.7 -8.6% ( IEA).   (Chris Nelder uses 5%)  For more info, see here, and here  
    
        The second factor takes into consideration the "Export Land Model".   The amount of oil available on the world market is already declining, and has been declining since 2006.  It will decline faster than the decline rate for production, because exporting countries will continue to subsidize oil use by their own people.  ( For a nice presentation of population growth and subsidies in oil producing countries see here.)     This will accelerate the decline for the 40% or so that the US imports.

      The third factor deals with the decline rate in the US.  And it accounts of the  "net energy" of the product.  As local firms rely more and more on fracking, the "energy cost" of the oil goes up, and less energy is left over for the rest of the economy.   Thus, according to one study, one barrel of oil invested in production of more oil yielded 15 barrels in 2000.  By 2010, the return had dropped to 10!    see here . 

      Time to grease up that bicycle!   

-------


Introduction
The problem we face is a liquid fuel crisis.  Absolutely essential vehicles, such as agricultural tractors and combines, railroads, and trucks run on diesel fuel, ships on bunker fuel.  They can never be battery or fuel-cell operated or electrified, nor do we have the decades it would take to build a new fleet even if there were a solution.
In 2011, the United States burned 29021 trillion BTU’s of mainly petroleum, which represented 13 billion tons of freight worth $11.8 trillion moved 3.5 trillion ton-miles:
  • Trucks: 69%  1.4 trillion miles  9.0 billion tons
  • Trains: 15%   1.3 trillion miles  1.9 billion tons
  • Ships:   3%
Non-essential Transportation Fuel (see Table 1 below)
1) Cars (28%) and light trucks (26%) use 55% of transportation fuel.  Let’s shift all of that55% to essential vehicles.  Implication: Just about everyone will be forced to move to cities because gas stations will be closed, and petroleum will mainly be refined into diesel,which gasoline cars can’t burn.
2) Let’s give most of this fuel to essential vehicles: 7% air travel, 1% recreational water boats, 3% Construction and Mining, 1% recreational vehicles (snowmobiles, etc).  That’s another 11% shifted to essential vehicles (leaving 1% for the above, mainly to maintain and fix infrastructure).
3) Essential vehicles: 20% Medium (class 3-6) and Heavy trucks (class 7-8), 4% ships, 2% rail freight, 3% pipelines, 2% agricultural.  A lot of this freight isn’t essential, so about half of this, 15%, can be saved by not shipping non-essential cargo and shipping essential goods shorter distances.
Essential transportation has been given 81% of diesel from other non-essential sources (55% + 11% + 15%).
Meanwhile, local and global production of oil will be dropping off rapidly
First, there’s the decline of oil from our own and global oil fields (peak oil production was reached in 2005), oil producing countries will export less because they’re using more oil themselves (ELM model), America and other nations are likely to be outbid by China, India, etc., for oil exports. Second, there’s the net energy cliff and the decline in the RATE of what we can get out of the ground now that petroleum is gunky and in remote places. Third, the financial system can interfere with oil production –  when credit dries up after the next financial crash, the money to drill won’t be available.

Optimistic scenario: 20 years before we hit the wall 

The likely decline rate is expected to accelerate. We’ve been on a plateau since 2005, but once production heads downhill, here’s a guess at what the decline rate might be per year: 4%, 5%, 6%, 7%, 8%, 9%, and 10% from then on.
But not to worry, we’ve got some wiggle room. Remember, of the grand total of 29021 trillion BTU’s of petroleum burned in America (Table 1 below), 81% was reassigned from non-essential vehicles and cargo to essential agriculture, railroads, trucks, industrial infrastructure equipment, and miscellaneous important vehicles (ambulances, police cars, military, etc).
The other 19% — 5,541 trillion BTU — is the rock-bottom amount we need to  keep society going.
With a 4/5/6/7/8/9/10/10 /10/….. decline rate scenario, we’ll dip below the essential transportation fuel needed 16 years from now.
Of course, we can import/export less cargo, grow food locally, stop immigration, encourage 1-child families, ship goods shorter distances, and many other oil-reducing strategies as well.  This is when techno-optimists have a chance to shine, and Postcarbon, Bay Localize, Transition Towns, and many other groups help governments and communities adapt.  If all goes well, panic is avoided, and diesel fuel can be stretched out even further, that could delay collapse another 4 years.

Pessimistic scenario: 1-12 years before we hit the wall

What if states that produce energy and/or have refineries stop sharing diesel and gasoline with other states at some point? In that case, Alaska, California, Texas, Louisiana, etc., might last longer than 20 years and other states would hit the wall sooner.
Also, there are many black swans.  Here’s some wild guesses about how soon collapse might come if one of them strikes:
1 year if there’s a small nuclear war, China or some other nation takes down America’s electric grid(s) in a cyberwar, or a world war erupts.
2-5 years if there’s a major disaster, because that will probably bring down the financial system and also drive up prices of oil, natural gas, electricity, wood, cement, steel, and other resources needed to recover with.
3-8 years if the financial system collapses and several other events are triggered, such as social chaos, no credit left for new oil wells to be drilled, and other knock-on effects.
5 years if nations go back to negotiating deals between producing and non-producing nations and bypass the international oil market. That could suddenly cut off America’s oil imports. We’re already seeing this with the historic deal Russia and China just cut for natural gas. China, India, and other countries can afford to pay more than the United States for oil. Other nations are far closer to Russia and OPEC nations, where 83% of world reserves lie.
8-10 years if America decides to go back to the Middle east to keep other nations from getting the 2/3 of oil reserves there. Our military can’t fight without oil, so that means a lot less for everyone else
Okay. I’m going to stop guessing.  I have no idea how much sooner collapse would occur given various events, or what the actual decline rates will be.  But here are a few more black swans to think about:
  • Oil shocks make investors “Peak Oil Aware” and world-wide stock markets crash
  • Decline rates even higher than posited above due to a combination of the Export Land Model and middle eastern countries having lied about how much oil reserves they had.
  • Oil choke-points are blocked by terrorists or nearby nations
  • War breaks out in the Middle East
  • Peak coal, peak natural gas, peak uranium, peak sand, peak water, peak topsoil, peak phosphorous, etc
  • Electric grid outages increasingly common
  • Our infrastructure is falling apart, many bridges are beyond their life-span or dangerously in need of repair, ports, energy pipelines, water treatment, sewage treatment, and other essential infrastructure has a life-span less than 50 years. The steel is rusting and the concrete is falling apart.
So, what do you think?
Alice Friedemann   www.energyskeptic.com
Table 1. Transportation energy use in America 2011 by BTU
Trillion BTU 2011%Trillion BTU 2011
TOTAL29021
   HIGHWAY21,815.30.75%
       Light vehicles15823.10.55cars8140.90.28
light trucks7629.00.26
Motorcycles53.20.00
       Buses194.40.01Transit91.50.00
Intercity29.80.00
School73.10.00
       Medium & Heavy trucks5797.80.20Class 3-6 trucks1282.60.04
Class 7-8 trucks4515.20.16
   NON-HIGHWAY5,151.90.18
       Air2162.10.07General aviation227.10.01
Domestic Air1494.70.05
International440.30.02
       Water1388.10.05Freight1143.20.04
Recreational244.90.01
       Pipeline949.00.03Pipeline949.00.03
       Rail609.10.02Freight (Class I)514.60.02
       Rail passenger overall140.90Passenger transit94.50.00
Passenger commuter31.90.00
Passenger Intercity14.50.00
   OFF-HIGHWAY2,053.90.07
       Agricultural Equipment573.90.02Tractors, mowers, combines, balers,
       Airport ground Equipment15.10
       Construction & Mining918.10.03Pavers, rollers, drill rigs, graders, backhoes, excavators, cranes, mining equipment
       Industrial Equipment340.20.01Forklifts, terminal tractors, sweeper/scrubbers
       Logging Equipment24.70Feller, buncher, skidder
       Railroad maintenance3.70
       Recreational equipment178.20.01Off-road motorcycles, snowmobiles, ATV, golf carts, specialty vehicles
Source: Chapter 2. Energy. Oak Ridge Natinoal Laboratory, Center for Transportation Analysis.
http://cta.ornl.gov/data/tedb32/Edition32_Chapter02.pdf


Labels: , , , , ,

Monday, May 26, 2014

NASA: Melt of Antarctic Glacier Unstoppable


Ice, ice, baby
  -Vanilla Ice

He feels the piston scraping --
Steam breaking on his brow --
Thank God, he stole the handle and
The train won't stop going --
No way to slow down.
   -Jethro Tull

Greetings

    I've been re-reading "Thinking In Systems"  by Donella Meadows.  It;s great stuff,  but hard on my linear thinking brain.  So, of course one of the features is self reinforcing feedback loops.    Regardless of the inputs from outside the system, they continue.    Apparently the Antarctic glaciers have sucha feedback. 

  The result ?  15 foot sea level rise.

NASA glaciologist Eric Rignot  put it this way:
“The collapse of this sector of West Antarctica appears to be unstoppable. The fact that the retreat is happening simultaneously over a large sector suggests it was triggered by a common cause, such as an increase in the amount of ocean heat beneath the floating sections of the glaciers. At this point, the end of this sector appears to be inevitable.”
   Portions of the NASA news conference are provided  courtesy of Radio Eco shock.    (see below)   Very interesting to listen to the news conference.  Several times, questioners asked something like :  "You don't really mean "unstoppable" , do you?"    And severa;l times the scientists said "Yes, We can't stop it, but we can speed it up!"


------------

Grim News From NASA: West Antarctica’s Entire Flank Collapsing Toward Southern Ocean, At Least 15 Feet of Sea Level Rise Already Locked-in Worldwide

(Must-watch NASA presentation finding six Antarctic Glaciers in irreversible collapse.)
Human-caused heat forcing. From the top of the atmosphere to the bottom of the world’s oceans, there’s no safe place to put it. For where-ever it goes it sets in place conditions with the potential to unleash gargantuan forces.
481. Minus aerosols, that’s the equivalent CO2 heat forcing humans have now built up in the atmosphere due to a constant and rapidly rising greenhouse gas emission. By itself, this heat forcing, were it to remain in the world’s atmosphere and ocean system, is enough to melt all of West Antarctica, all of Greenland, and part of East Antarctica pushing sea levels higher by between 30 and 120 feet or more.
Inertia. Namely, the massive inertia in the Earth climate system creating a perceived ability to resist rapid destabilization due to the human insult. It’s the one hope scientists and policy-makers alike pinned on the possibility of bringing human greenhouse gas emissions down in time to prevent radical and damaging change.
Rapid glacier and ice sheet destabilization. What, by 2014, became understood as the new reality, as an ever-increasing number of the world’s glaciers displayed far less resilience than previously anticipated and were set in motion to an unstoppable and catastrophic reunion with the world’s oceans by human warming.
Now, a new NASA study finds that six of West Antarctica’s largest glaciers are in a state of irreversible collapse. These add to a growing tally of destabilized glaciers from Greenland to Svalbard to Baffin Island to Antarctica and beyond which, all together, show that at least a 15 foot sea level rise from human-spurred glacial release is now inevitable.
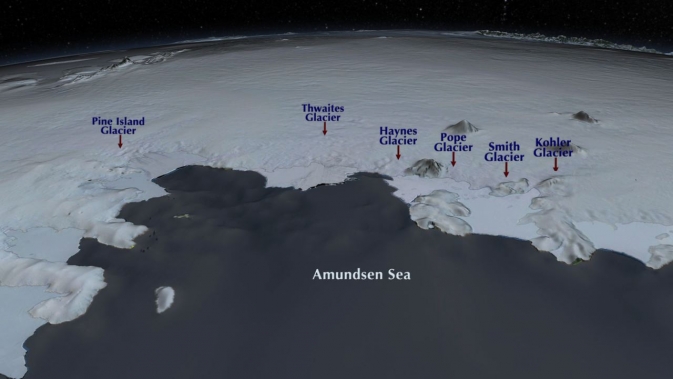
Their names were Pine Island, Thwaites, Haynes, Pope, Smith and Kohler
antarctica_screen_grab1_2
(The locations of West Antarctica’s ‘butcher board’ glaciers — those that are doomed to an inevitable embrace with the Amundsen Sea. Image source: NASA.)
At issue are six massive glaciers representing more than 1/3 of total the ice mass of West Antarctica and what could well be called its entire weak flank.
As early as 1968, this massive section of West Antarctica was listed as unstable. Since that time, human heat forcing has pumped higher and higher volumes of warmth deep into the Pacific Ocean. The warmth pooled in the depths, building, even as it rose up beneath Antarctica. Ocean circulation and Ekman pumping along the coast of Antarctica brought this warm water up from the depths where it traveled along the continental shelf zone to encounter Antarctica’s mile-high glaciers. The warm water did its work, unseen, for a time. Eating away at the bottoms of these glaciers and speeding their slide to the sea. The increased glacial melt and related fresh water outflow put a kind of cold water cap on the Southern Ocean around Antarctica. This cold cap gave the ever-warming bottom waters no outlet to the surface and so the heat concentrated where it was needed least — at the bases of massive ocean-fronting glaciers.
One section of West Antarctica, composed of the six glaciers now listed as undergoing irreversible collapse, was particularly vulnerable to this basalt melt and ocean upwelling heat forcing. For the glaciers there rested on a section of continental shelf well below sea level — extending scores of miles beneath the ice and on into interior Antarctica. As a result, newly undercut glaciers are flooded until they float, creating lift, reducing friction and rapidly speeding the glacier’s plunge seaward. Even worse, few sub-glacier ridges — speed bumps that glaciologists call grounding points — interrupt the more rapid flow of these glaciers once initiated.
(NASA slide-show illustrating the process of basal melt and grounding line retreat)
By earlier this year, a separate NASA study found that the Pine Island Glacier (PIG), one of the world’s largest glaciers and the most vulnerable ice sheet in West Antarctica, had entered a state of irreversible collapse. Now, the most recent study, led by glaciologist Eric Rignot at NASA’s Jet Propulsion Laboratory, finds that five of its fellows — Thwaites, Haynes, Pope, Smith, and Kohler — are following PIG’s lead.
Rignot’s findings could not be more stark:
“The collapse of this sector of West Antarctica appears to be unstoppable. The fact that the retreat is happening simultaneously over a large sector suggests it was triggered by a common cause, such as an increase in the amount of ocean heat beneath the floating sections of the glaciers. At this point, the end of this sector appears to be inevitable.”
In other words, over the course of decades-to-centuries, these glaciers will disintegrate and slide into the sea until they are no more. Years from now, their names will be a distant memory, reminders of a faded and far better time.
At Least 15 Feet of Sea Level Rise From Glacial Melt Now Locked-in
This year, the pace of new announcements for massive glaciers undergoing destabilization or irreversible collapse could best be described as terrifying and unprecedented. And each new announcement brings with it starker implications for both the ultimate pace and scope of global sea level rise.
Global sea level rise
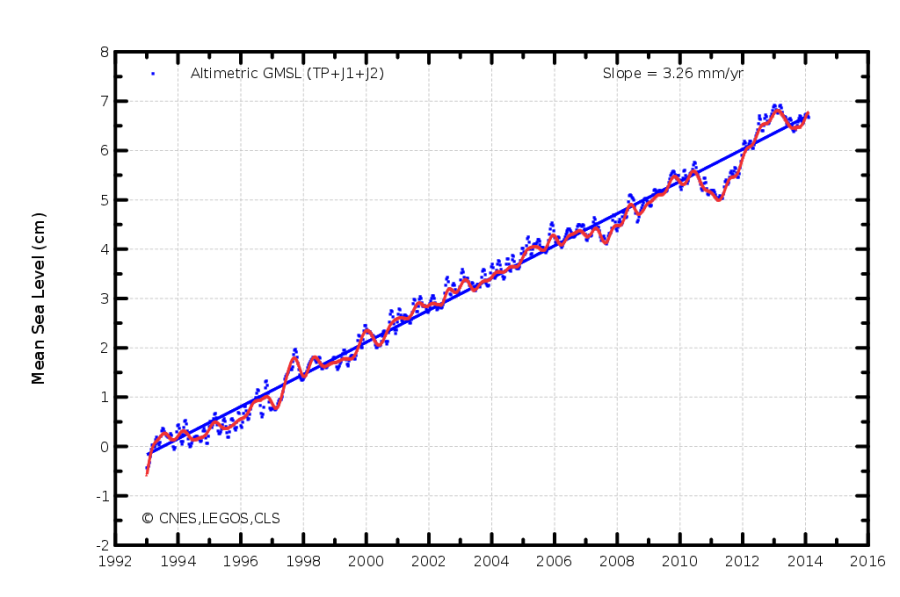
(Current pace of global sea level rise at 3.26 mm per year is likely now set to rapidly accelerate coincident with the rapid acceleration and melt of an ever-increasing number of the world’s glaciers. Image source: AVISO.)
The amount of sea level rise to result from just the loss of the disintegrating section of West Antarctica described in the most recent NASA study amounts to at least four feet. But looking around the world we also find rapid destabilization of more than 13 glaciers encircling all of Greenland with one, the Zacharie Glacier, featuring an ice flow that stretches all the way to the center of the Greenland ice mass. Recent studies also find that the massive glaciers of Baffin Island and the world’s largest ice cap — the Austfonna glacier on Svalbard’s island of Nordaustlandet — are all locked in an inevitable seaward rush.
The total water composed in the moving and destabilized glaciers worldwide is now at least enough to raise world ocean levels by a total of 15 feet. But the inevitable loss of these glaciers tells a darker tale, one that hints that the 23 feet worth of sea level rise in all of Greenland’s ice and the 11-13 feet of sea level rise in all of West Antarctica’s ice may well be locked in to what is a growing daisy chain of explosive destabilization if human greenhouse gas levels aren’t radically drawn down.
In continuing to emit greenhouse gasses, we make the situation ever worse by imposing a heightening heat pressure on glacial systems that will both speed their release and ensure that an ever growing portion of the Earth’s ice ultimately melts. The current forcing though both extreme and dangerous is small compared to the potential forcing should we not rapidly reign in the human emission.
Links:
Hat tip to Peter Sinclair and Colorado Bob

-------


ANTARCTICA IS MELTING!

SUMMARY: Gasp! Antarctica is melting. Coastal cities at risk. New science direct from NASA. Plus eminent climate scientist Kevin Trenberth predicts strong El Nino impacts on world weather. Radio Ecoshock 140521

Welcome to Radio Ecoshock, I'm Alex Smith - but you won't hear much from me in this program. There is huge news from the Antarctic. Scientists fears that those glaciers will melt, lifting global sea levels above the streets of many world coastal cities - have been verified by two studies.

Later in the program, you will hear an excellent interview of top climate scientists Kevin Trenberth, conducted by Peter Sinclair.


Download this Radio Ecoshock show in CD Quality (56 MB) or Lo-Fi (14 MB)

FREE CLIMATE AUDIO QUOTES

At the bottom of this blog you can also find out about our new climate music contest, and links to download key climate quotes from Radio Ecoshock interviews. You can use these quotes for music, or in your podcast, radio show, or as audio for your web page or blog. Help yourself, help the world.

THE BIGGEST CLIMATE NEWS THIS YEAR - ANTARCTICA IS MELTING

But right now we're going to bypass the mainstream media machine to hear from the NASA scientists who say the melt of one Antarctic glacier set is now "unstoppable". We don't often get such certainty from science, or large government agencies.

This is a moment to gasp, just like the record Arctic sea ice melt of 2007. The planet has undeniably and unmistakably been altered. It's a major tipping point crossed. Even without the Greenland Ice melt, the Antarctic glaciers will reshape the geography of land for all conceivable generations to come. Redraw the maps, and realize humans will eventually withdraw from mega-cities ranging from New York to China, a retreat from the sea by millions of people, from trillions of dollars in assets. That's what this is about.

I play you an edited-for-radio replay of the NASA press conference held May 12th for the media.

Scientists have long feared that human-made climate change would trigger melting of Antarctic glaciers, especially in the fragile West Antarctic Peninsula. Now the bad news is upon us: Antarctica is melting. The process NASA scientists say, is unstoppable. The inevitable result will be massive sea level rise over the next several centuries. Some scientists suggest 7 meters, or 22 feet of sea level rise is even possible this century, but the NASA study is more conservative, as you will hear.

Keep in mind when the study authors talk about 3 meters, or 10 feet of global sea level rise, they are discussing only the potential from a small part of the West Antarctic Peninsula they have studied, not the totals from elsewhere among the South Pole glaciers, or melt waters from Greenland.


Eric Rignot

We begin with the voice of Thomas Wagner, NASA's Program Scientist for the cryosphere and Director of the agency's polar studies. He is introducing the lead scientist for this Antarctic study, Eric Rignot. Eric is Professor of Earth System Science at the University of California, Irvine. You will hear his entire presentation for the NASA teleconference, held May 12th, 2014.


Sridhar Anandakrishnan

Our next speaker at the NASA teleconference is Sridhar Anandakrishnan, Professor of Geosciences at Pennsylvania State University.

I then play you key questions from major media to these scientists and their replies. It's also an exercise in seeing what TV networks and top tier newspapers ask. You can then compare how that filters through to the public. For example, while these NASA scientists say the Antarctic glacier melt they studied IS unstoppable, the New York Times reported it MAY be unstoppable. The certainty of science did not make it to the public.

You can watch the NASA teleconference in full here.

The fact that Antarctica is committed to melting, or at least parts of the West Antarctic Peninsula are, is one of the biggest stories in years. Joe Romm, the respected energy expert and blogger at Climate Progress, says this means coastal cities in many parts of the world will ultimately be abandoned.

You can see what the United States will look like with just ten feet (3 meters) of sea level rise here.

I also recommend this short video by Peter Sinclair - "This Is Not Cool". He interviews scientists, with a couple of news clips, about huge sea level rise coming.

Mother Jones has this key article about the West Antarctic ice sheet collapse.

You can get more essential facts from this Washington Post article.

EAST ANTARCTICA ALSO AT RISK OF MELTING

But it's not just the West Antarctic peninsula, although that will go first. New science finds East Antarctica, long thought impervious to near-term climate change, is also at risk of melting.

TWENTY TWO FEET OF SEA LEVEL RISE BY 2070?

The most extreme prediction comes when University of Ottawa climate scientist Paul Beckwith asks whether we could see 7 meters of sea level rise (22 feet!) by 2070. Find that in this You tube video. Paul also points out that moving massive amounts of water from land-based glaciers to the oceans could destabilize weak spots in the Earth's crust, leading to more seismic activity (read deadly earthquakes and tsunamis).

You can read Peter Sinclair's blog article about important New York Times coverage of this Antarctic melting news, plus references to the original science, here.

Unfortunately, one of the original scientific papers is behind a pay wall. Here is the linkanyway.

Labels: , , , ,