Of decline rates, and export land and cabbages and kings
We'll meet under that giant Exxon sign
- Bruce Springsteen (Jungle Land)
Baby you can drive my car
-The Beatles
Greetings
As we all know, in the oil production world, there are three biggies - US, Russia, and Saudi Arabia. Then there is the rest. These top three produce about 1/3 of the world total, so it makes sense to keep an eye on them.
From an "export land" perspective, it is important to look both at production, and oil consumption within these countries.
The US peaked in the 70's. , but as we hear constantly from the media has recently reversed its decline. (For an nice take on the propaganda campaign see Orwellian Newspeak and the Oil Industry) This development is admitted to be short lived, with the EIA predicting a decline by 2019, (" Crude oil production (including lease condensate) increases from 13.9 quadrillion Btu in 2012 to a peak of 20.5 quadrillion Btu in 2019 ") and others as early as 2016. Decline rates have historivally been low, however decline rates from fracked wells are quite large, so it is not clear what the future holds. Although oil use in the US dropped dramatically in recent years, the numbers for 2013 show a new surge in use. see here. (Total oil consumption rose by 400,000 barrels, and even gasoline use rose - for the first time since 2007) .
Russia, has apparently peaked as well. (!). This development has,of course, not, been trumpeted by the media. But the Russian government has confirmed that production is expected to fall ("The ministry said Monday it expects a $4.5 billion decline in oil export revenue because of an anticipated 6.3 percent drop in oil production...". see here OPEC is also assuming a decline of Russian production. For a good summary of the Russian production situation see here.. Oil consumption in Russia has been on a plateau since the breakup of the USSR.
No one really knows whats happening in Saudi. They are on a production plateau. Whether they can increase ir not, is unknown. Normally they will increase when some other country goes off line. But when Libya's production dropped, they did not step in. One the consumption side, things have changed dramatically. Despite efforts to diversify their energy use, oil use has shot up. See chart.below.
So, in summary: Russia production is rolling over, and likely to decline sharply. The US production is due to peak in the next few years, and consumption is apparently growing again. Saudi production seems to be flat, with consumption growing rapidly. The impact to net exports is pretty straightforward. The three largest producers will either be exporting less, or (in the case of the US) - importing more.
There are some counties with "spare capacity" - Iraq, Libya and Nigeria come to mind. But how likely are they to plug the hole?
-------
SUNDAY, JULY 13, 2014
Tech Talk - Here we go again, again
A couple of posts or so ago I mentioned that there are three major problems sitting relatively un-noticed as we head into the mess of Peak Oil. Of these, perhaps the one that gets the least attention is the steady decline in production from existing wells. We are just about at the point where the Alaskan Pipeline will tip over into feeding less than half-a-million barrels a day down from the North Slope. (It sent 501 kbd down the pipe in June with a 98.6% reliability factor). At the same time those in control of the oilfields in the Russia are reporting that Russian exports have fallen to the lowest level in 6 years. This brings back the relatively unrecognized reality of the Export Land Modelwhich Jeffrey Brown first introduced on The Oil Drum back in 2007.
It is worth resurrecting that thinking (which time has proven to be only too true) as we look at the continued declines in production from the UK, as an example. It is not easily discernable from the official Department of Energy and Climate Change, which plots oil production on a monthly basis (with different months having a variety of days):

Figure 1. Monthly production of oil from the fields of the UK continental shelf (DECC ).
Euan Mearns has, however, done the necessary arithmetic and clearly shows the reality of the situation once one converts it back to barrels per day:

Figure 2. UK production of oil and natural gas over the past decade (Euan Mearns)
The steady decline has also been noted by the EIA who commented that UK production fell by 9% from 2012 to 2013. There was a time, back in the days of The Oil Drum, where we debated whether an estimate of 5% for field decline rates was or was not too high. Obviously those days are now behind us, and reality is starting to show numbers that far exceed the rates that, at the time, some thought rather pessimistic. To continue the UK numbers, as OPEC recently anticipated, the decline this year will take the total down to 800 kbdwith an 8% decline expected for this year.
The Export Land Model, in its simplest form, can be illustrated with the following plot:

Figure 3. A simplified illustration of the changing production, internal use and exports for an oil producing country, once it reaches a peak in production (Sam Foucher )
The argument that produces the above plot goes along the lines that, as an oil producer (think for a moment of Russia for eg) produces larger volumes of oil, so the economy of that country starts to grow. As that growth continues it demands an increasing amount of energy to sustain the increased internal demand (the green line). However, once production stabilizes or starts to decline (the blue line above) so the amount available for export becomes reduced (the red line).
The three top producers of petroleum products in the world are the United States, Russia and the Kingdom of Saudi Arabia. The United States consumes far more than it produces, and thus is already a net importer of petroleum products, although in the short term, as I noted earlier production gains from the Bakken and Eagle Ford are hiding the problems of decline rate. It is increasingly unlikely that any significant volume of US oil will make it onto the world market.
Saudi Arabia has, for years, controlled the amount of oil that it puts on the market, based on the anticipated global demand, and the supply available from the rest of the world - so that the global price remains at a level to sustain OPEC economies. That has been illustrated over the past couple of years by the increase in production from the KSA to cover the decline from Libya as about a million barrels a day disappeared from the global market. The gains in production from the US helped in meeting global demand and the strain in supply was thus relatively easily hidden. But the KSA has an imminent problem that has largely disappeared from public view now that the eyes of The Oil Drum correspondents have lost that focus.
The major oilfields of the Kingdom are old, and to sustain production perimeter wells were located around the oilfields that injected millions of barrels of seawater a day, to drive the oil towards the center of the fields, where it could be relatively easily recovered from Maximum Reservoir Contact wells drilled along the very top of the reservoirs. But as folk such as JoulesBurn have noted, those wells slowly change in nature, over time, as the oil migration continues, and water injection must move inwards to ensure continued production.

Figure 4. Layout of initial wells at the Haradh III development in the Ghawar oilfield in Saudi Arabia (JoulesBurn at The Oil Drum)
He noted, in the original post, that Aramco had to drill some 52 wells, rather than the estimated 32, to get the production they needed, and that was back in 2010. Since then Ghawar has continued to produce for the Kingdom, but with daily levels of up around 10 mbd, the volumes in the crests of the anticlines along which the oil wells sit within the Ghawar field have been steadily contracting, and although they have carried out some of the most advanced oilwell engineering to sustain production from the attic oil in the older parts of the fields, there are only so many ways you can squeeze a rock before you get out all the oil that you will – and those days are approaching fast.
At the same time (relating back to the ELM) while Saudi production has remained at just under 10 mbd for the past few years, internal demand has been rising at a steadily more rapid rate.

Figure 5. Internal consumption of oil in Saudi Arabia (Index Mundi ).
Hoping to transition some of the current internal demands to natural gas, the KSA has been looking for internal resources to allow it to move away from oil. However the search has not been as successful as hoped, particularly with the search for natural gas, Shell having backed out of the program as a result of the poor results to date.
With internal consumption continuing to rise at more than twice the rate anticipated by the ELM shown in Figure 3, and, at best, stable production, global exports from the Kingdom are of increasing concern.
Which brings us back to Russia, where the new fields that must be exploited to sustain production are in remote parts of Eastern Siberia and the Yamal Peninsula – if not offshore in the Arctic.
Russian oil production has been peaking for some time (falling from 3.4% growth in 2012 to 1.3% in 2013) and is now reported to likely fall by 6.3% over the next two years. Since this implies that Russia is now at peak, the decline in overall production initially will fall below that of Figure 3, though likely only for a year or so, before the rate will be, at minimum, that shown. (The reason for this conclusion comes from the lack of enough investment in the fields where growth can be expected). At the same time internal demand is rising at around 100 kbd or 3% pa slightly above the value assumed for Figure 3.
If none of the three largest producers can even sustain exports, and the ELM explains why they can’t, and world demand continues to rise at the rates projected, then, in even the short-term, something is going to have to give. The logical weakest link is price, with the consequence, that invalidates a lot of the other arguments, of a significant impact on global economic health. As we have seen before, significant increases in price lowers the demand for oil, and thus demand from the various nations will become even more skewed.
The only problem, with this next iteration, is that there isn’t another Bakken or Eagle Ford conveniently sitting waiting to be tapped.
It is worth resurrecting that thinking (which time has proven to be only too true) as we look at the continued declines in production from the UK, as an example. It is not easily discernable from the official Department of Energy and Climate Change, which plots oil production on a monthly basis (with different months having a variety of days):

Figure 1. Monthly production of oil from the fields of the UK continental shelf (DECC ).
Euan Mearns has, however, done the necessary arithmetic and clearly shows the reality of the situation once one converts it back to barrels per day:

Figure 2. UK production of oil and natural gas over the past decade (Euan Mearns)
The steady decline has also been noted by the EIA who commented that UK production fell by 9% from 2012 to 2013. There was a time, back in the days of The Oil Drum, where we debated whether an estimate of 5% for field decline rates was or was not too high. Obviously those days are now behind us, and reality is starting to show numbers that far exceed the rates that, at the time, some thought rather pessimistic. To continue the UK numbers, as OPEC recently anticipated, the decline this year will take the total down to 800 kbdwith an 8% decline expected for this year.
The Export Land Model, in its simplest form, can be illustrated with the following plot:

Figure 3. A simplified illustration of the changing production, internal use and exports for an oil producing country, once it reaches a peak in production (Sam Foucher )
The argument that produces the above plot goes along the lines that, as an oil producer (think for a moment of Russia for eg) produces larger volumes of oil, so the economy of that country starts to grow. As that growth continues it demands an increasing amount of energy to sustain the increased internal demand (the green line). However, once production stabilizes or starts to decline (the blue line above) so the amount available for export becomes reduced (the red line).
The three top producers of petroleum products in the world are the United States, Russia and the Kingdom of Saudi Arabia. The United States consumes far more than it produces, and thus is already a net importer of petroleum products, although in the short term, as I noted earlier production gains from the Bakken and Eagle Ford are hiding the problems of decline rate. It is increasingly unlikely that any significant volume of US oil will make it onto the world market.
Saudi Arabia has, for years, controlled the amount of oil that it puts on the market, based on the anticipated global demand, and the supply available from the rest of the world - so that the global price remains at a level to sustain OPEC economies. That has been illustrated over the past couple of years by the increase in production from the KSA to cover the decline from Libya as about a million barrels a day disappeared from the global market. The gains in production from the US helped in meeting global demand and the strain in supply was thus relatively easily hidden. But the KSA has an imminent problem that has largely disappeared from public view now that the eyes of The Oil Drum correspondents have lost that focus.
The major oilfields of the Kingdom are old, and to sustain production perimeter wells were located around the oilfields that injected millions of barrels of seawater a day, to drive the oil towards the center of the fields, where it could be relatively easily recovered from Maximum Reservoir Contact wells drilled along the very top of the reservoirs. But as folk such as JoulesBurn have noted, those wells slowly change in nature, over time, as the oil migration continues, and water injection must move inwards to ensure continued production.

Figure 4. Layout of initial wells at the Haradh III development in the Ghawar oilfield in Saudi Arabia (JoulesBurn at The Oil Drum)
He noted, in the original post, that Aramco had to drill some 52 wells, rather than the estimated 32, to get the production they needed, and that was back in 2010. Since then Ghawar has continued to produce for the Kingdom, but with daily levels of up around 10 mbd, the volumes in the crests of the anticlines along which the oil wells sit within the Ghawar field have been steadily contracting, and although they have carried out some of the most advanced oilwell engineering to sustain production from the attic oil in the older parts of the fields, there are only so many ways you can squeeze a rock before you get out all the oil that you will – and those days are approaching fast.
At the same time (relating back to the ELM) while Saudi production has remained at just under 10 mbd for the past few years, internal demand has been rising at a steadily more rapid rate.
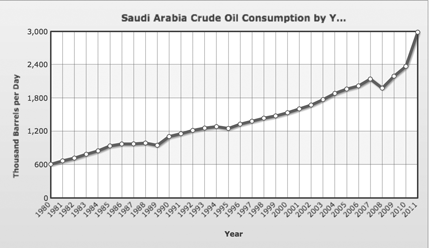
Figure 5. Internal consumption of oil in Saudi Arabia (Index Mundi ).
Hoping to transition some of the current internal demands to natural gas, the KSA has been looking for internal resources to allow it to move away from oil. However the search has not been as successful as hoped, particularly with the search for natural gas, Shell having backed out of the program as a result of the poor results to date.
With internal consumption continuing to rise at more than twice the rate anticipated by the ELM shown in Figure 3, and, at best, stable production, global exports from the Kingdom are of increasing concern.
Which brings us back to Russia, where the new fields that must be exploited to sustain production are in remote parts of Eastern Siberia and the Yamal Peninsula – if not offshore in the Arctic.
Russian oil production has been peaking for some time (falling from 3.4% growth in 2012 to 1.3% in 2013) and is now reported to likely fall by 6.3% over the next two years. Since this implies that Russia is now at peak, the decline in overall production initially will fall below that of Figure 3, though likely only for a year or so, before the rate will be, at minimum, that shown. (The reason for this conclusion comes from the lack of enough investment in the fields where growth can be expected). At the same time internal demand is rising at around 100 kbd or 3% pa slightly above the value assumed for Figure 3.
If none of the three largest producers can even sustain exports, and the ELM explains why they can’t, and world demand continues to rise at the rates projected, then, in even the short-term, something is going to have to give. The logical weakest link is price, with the consequence, that invalidates a lot of the other arguments, of a significant impact on global economic health. As we have seen before, significant increases in price lowers the demand for oil, and thus demand from the various nations will become even more skewed.
The only problem, with this next iteration, is that there isn’t another Bakken or Eagle Ford conveniently sitting waiting to be tapped.
POSTED BY HEADING OUT AT 10:38 PM 
Labels: Export land model, Peak Oil, Russia, Saudi Arabia, tight oil
posted by Walter @ 9:48 AM
0 Comments


