Friday, November 30, 2012

The one that rules them all


Greetings Peaksters

     Below Professor Hamilton opines that the oil peak is nigh, and notes that that the current production plateau since 2005 has caused prices to double, putting "significant  burdens" on economies.   Will things get better  in the future, when we leave the plateau, and  production starts to decline?

    "We like to think that the reason we enjoy our high standard of living is because we have been so clever at figuring out how to use the world’s available resources. But we should not dismiss the possibility that there may also have been a nontrivial contribution of simply having been quite lucky to have found an incredibly valuable raw material that was relatively easy to obtain for about a century and a half."

    Is oil just one resource?  Or is it the "one that rules them all"    What makes oil so special?  Perhaps it's portability - making long trips, and re-fueling so easy.   Whatever it is, we have built our infrastructure around it.  

     Gail Tverberg likens it to a making cookies, and running out of flour.  There's no substitute.
 "When ya gotta have, ya gotta have it!"

http://ourfiniteworld.com/2011/02/02/how-is-an-oil-shortage-like-a-missing-cup-of-flou/

----------------

http://economics.ucsd.edu/economicsinaction/issue-7/exhaustible-resources.php


By James D. Hamilton, Ph.D.
Oil is fundamentally a depletable resource – once a barrel is extracted from the ground and burned, it is gone. Nevertheless, world oil production has continued to increase steadily for the last century and a half. Most economists attribute this to technological progress. Each year our methods for finding oil become more sophisticated, and our extraction methods more efficient. Unquestionably this progress has been quite remarkable, with oil now being produced by wells that begin a mile below the surface of the sea and proceed for several more miles through rock to get to the oil-bearing formations.

Brief History of Oil Production

Technological progress is not the only reason that oil production has increased over time. The industry was born in the Oil Creek District of Pennsylvania in 1859. Figure 1 shows annual crude oil production for the states of Pennsylvania and New York since then. Production from the original Oil Creek District reached its maximum level in 1874, and total production from the two original oil states peaked in 1891. There was a resurgence of production as a result of secondary and tertiary recovery methods developed in the 1920s, though these were never enough to return production to where it had been in the 19th century.
Annual crude oil production (in thousands of barrels per year) from the states of Pennsylvania and New York combined, 1860-2011.
Figure 1. Annual crude oil production (in thousands of barrels per year) from the states of Pennsylvania and New York combined, 1860-2011. Updates Figure 2 in James D. Hamilton, “Oil Prices, Exhaustible Resources, and Economic Growth,” inHandbook of Energy and Climate Change (in press).
It is remarkable to me that today, with our truly impressive new technology and with a real price of oil that is five times as high as it was in 1891, we’re producing less than one eighth as much from these regions as we did in 1891. Our best modern efforts are only able to match what was achieved by post-bellum roughnecks with the primitive production methods of 1868.
This, however, was not the end of the U.S. oil industry. Even as production from the original fields in Pennsylvania was on the way down, production began in neighboring Ohio, where it did not peak until 1896, and West Virginia, which peaked in 1900. When you look at production from the United States as a whole (which in the 19th century was primarily these three states), it seemed to increase steadily from 1859 to 1900, as increases in new regions made up for declines in the original.
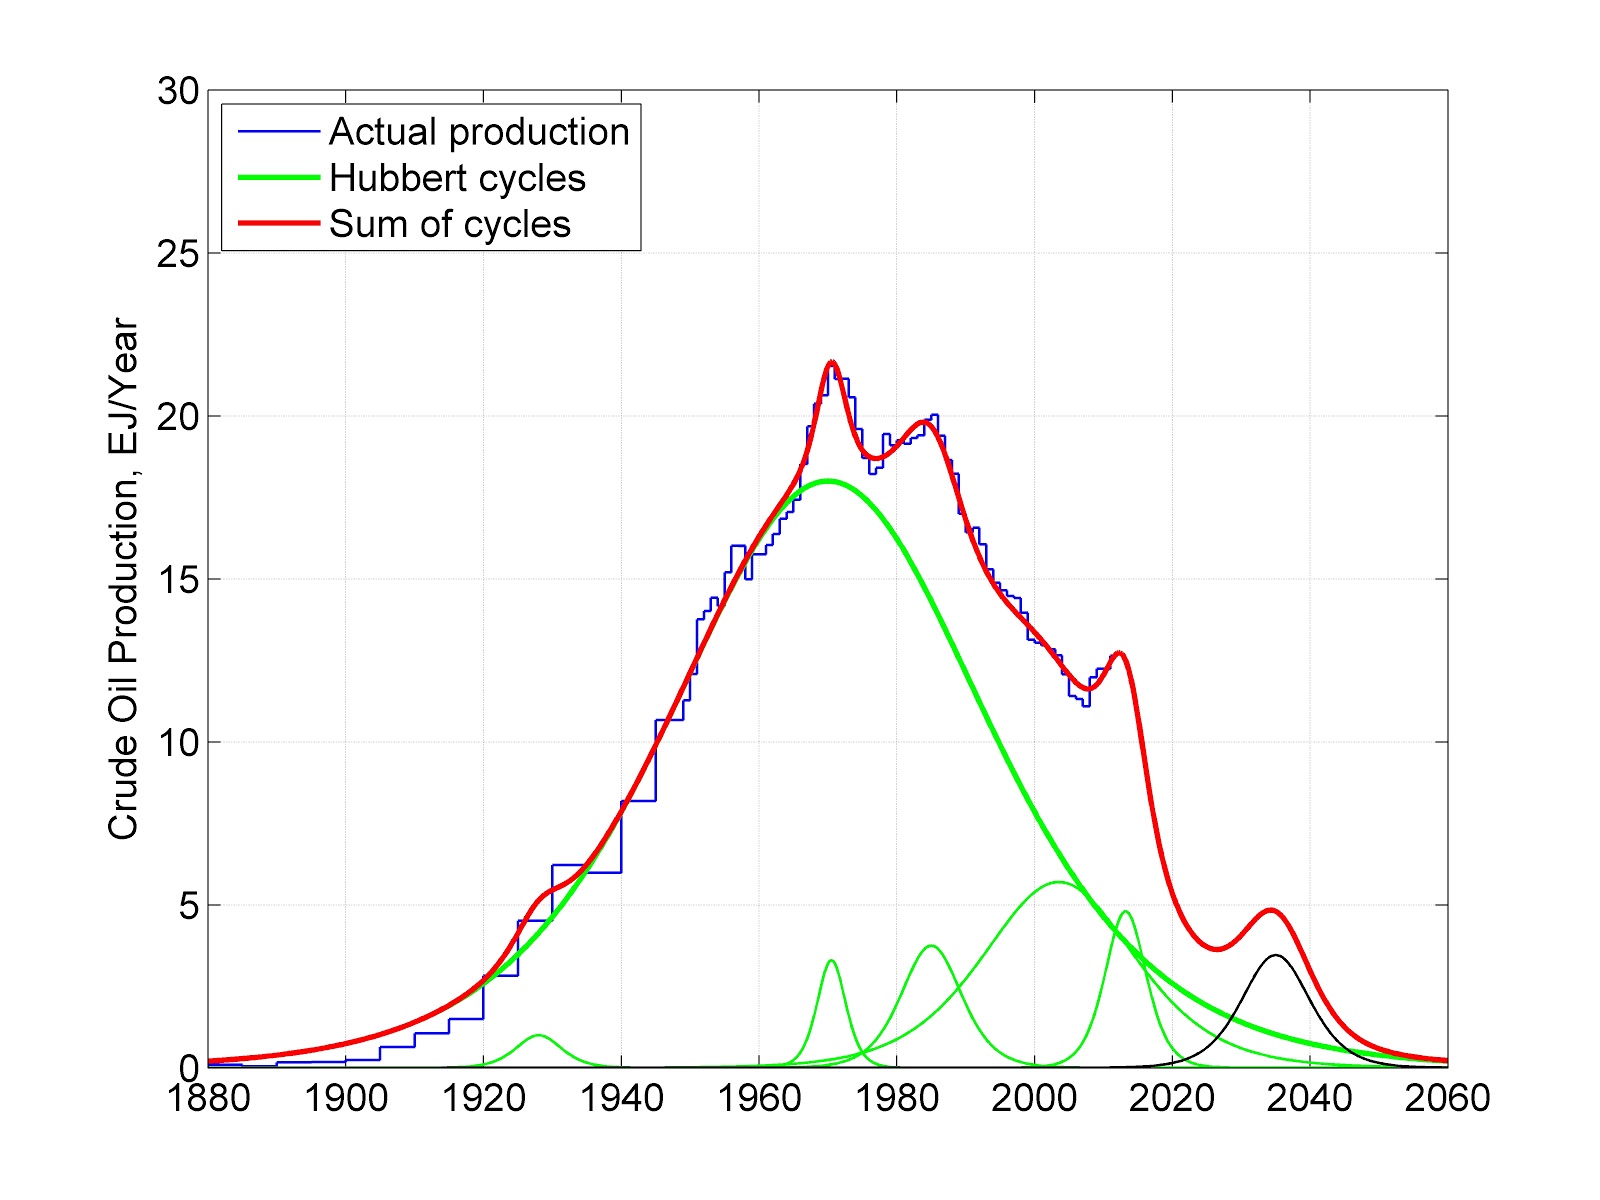
Despite the depletion of the Appalachian fields, U.S. production was to continue to increase as we entered the 20th century. This was achieved by a migration of the industry to new producing areas such as Illinois and Indiana (which would not peak until 1940), Kansas-Nebraska (peaked in 1957) and the four-corner states of the American Southwest (peaked in 1960), all of which proved to be far better places for obtaining oil than Appalachia. As production from these areas went into decline, even better fields were found in what ultimately proved to be the United States’ four most productive states – California, Oklahoma, Texas and Louisiana – whose respective production peaks in 1985, 1927, 1972 and 1971 are seen in Figure 2.
Annual crude oil production (in thousands of barrels per year) from four leading producing states, 1860-2011.
Figure 2. Annual crude oil production (in thousands of barrels per year) from four leading producing states, 1860-2011. California includes offshore and Louisiana includes all Gulf of Mexico U.S. production. Updates Figure 6 in James D. Hamilton “Oil Prices, Exhaustible Resources, and Economic Growth,” in Handbook of Energy and Climate Change (in press).
The combined effect is that if one looks at a plot of total U.S. production, it seems to increase more or less continuously from 1859 until peaking in 1970; however, the major factor driving this is not development of new technology, but instead the exploitation of new oil-producing regions.

Oil Production Today

Right now there is considerable excitement about the potential for new horizontal fracturing methods to free oil from shale and other tight formations that traditionally had been inaccessible. This technological innovation is producing impressive production gains in places such as North Dakota and Texas; however, despite these gains, U.S. crude oil production in 2011 was still less than 60 percent of what it was in 1970. And a key unknown is how quickly production is likely to decline after the initial surge. The North Dakota Department of Mineral Resources estimates that production from a given fracking well will decline 80 percent within two years of initial production.
But despite the fact that U.S. oil production today is far below its level of 40 years ago, world oil production increased 33 percent between 1973 and 2010. Here again the story is one of development of new areas. These include the North Sea and Mexico, which went from 1 percent of world production in 1973 to 13 percent in 1999; however, the North Sea is now only producing at about half of its 1999 level, and Mexico is down 25 percent from its peak in 2004.

The Future of Oil Production

Other regions, such as central Asia, Africa, and Brazil continue to increase, and the government of Iraq is optimistic that quite substantial production gains can still be achieved there. These helped offset the North Sea and Mexican declines so that world production in 2010 was about at the same level as in 2005, and started to increase again in 2011 and 2012.
My view is that with these new fields and new technology, we’ll see further increases in U.S. and world production of oil for the next several years. But, unlike many other economists, I do not expect that to continue for much beyond the next decade. We like to think that the reason we enjoy our high standard of living is because we have been so clever at figuring out how to use the world’s available resources. But we should not dismiss the possibility that there may also have been a nontrivial contribution of simply having been quite lucky to have found an incredibly valuable raw material that was relatively easy to obtain for about a century and a half.
My view is that stagnant world oil production and doubling in the real price of oil over 2005-2010 put significant burdens on the oil-consuming economies. Optimists may expect the next century and a half to look like the last. But we should also consider the possibility that it will be only the next decade that looks like the last.

Dry spells


Greetings Peaksters

     Since Sandy everyone is talking about storms.  But according to
Masters, the drought of 2012 had a bigger impact.    Agriculture is
getting it from two sides.  On the one hand, higher fuel costs,  on
the other reduced yields.

    Hopefully we don't get back- to- back droughts because the
reserves are getting lower.

      http://planetsave.com/2012/10/19/global-food-reserves-lowest-in-40-years/

PS  Don't miss Ken Burns's Dustbowl  on PBS
-----

"We should not assume that the 21st century global civilization is
immune from collapse due to drought. If we continue on our current
path of ever-increasing emissions of carbon dioxide, the hotter planet
that we will create will surely spawn droughts far more intense than
any seen in recorded history, severely testing the ability of our
highly interconnected global economy to cope"

Lessons from 2012: Droughts, not Hurricanes, are the Greater Danger
http://classic.wunderground.com/blog/JeffMasters/article.html

The colossal devastation and loss of life wrought by Hurricane Sandy
makes the storm one of the greatest disasters in U.S. history. The
storm and its aftermath have rightfully dominated the weather
headlines this year, and Sandy will undoubtedly be remembered as the
most notable global weather event of 2012. But shockingly, Sandy is
probably not even the deadliest or most expensive weather disaster
this year in the United States--Sandy's damages of perhaps $50 billion
will likely be overshadowed by the huge costs of the great drought of
2012. While it will be several months before the costs of America's
worst drought since 1954 are known, the 2012 drought is expected to
cut America's GDP by 0.5 - 1 percentage points, said Deutsche Bank
Securities this week. “If the U.S. were growing at 4 percent, it
wouldn’t be as big an issue, but at 2 percent, it’s noticed,” said
Joseph LaVorgna, the chief U.S. economist at Deutsche. Since the U.S.
GDP is approximately $15 trillion, the drought of 2012 represents a
$75 - $150 billion hit to the U.S. economy. This is in the same range
as the estimate of $77 billion in costs for the drought, made by
Purdue University economist Chris Hurt in August. While Sandy's death
toll of 113 in the U.S. is the second highest death toll from a U.S.
hurricane since 1972, it is likely to be exceeded by the death toll
from the heat waves that accompanied this year's drought. The heat
waves associated with the U.S. droughts of 1980 and 1988 had death
tolls of 10,000 and 7,500 respectively, according to NOAA's National
Climatic Data Center, and the heat wave associated with the $12
billion 2011 Texas drought killed 95 Americans. With July 2012 the
hottest month in U.S. history, I expect the final heat death toll in
the U.S. this year will be much higher than Sandy's death toll.


Drought: civilization's greatest natural enemy
People fear storms, and spectacular and devastating storms like
Hurricane Sandy and Hurricane Katrina have stirred more debate in the
U.S. about taking action against climate change than any other weather
event. But I argue that this attention is misplaced. Drought is our
greatest enemy. Drought impacts the two things we need to live--food
and water. The history of civilization is filled with tales of great
storms that have killed thousands and caused untold suffering and
destruction. But cities impacted by great storms inevitably recover
and rebuild, often stronger than before. I expect that New York City,
the coast of New Jersey, and other areas battered by Sandy will do
likewise. But drought can crash civilizations. Drought experts Justin
Sheffield and Eric Wood of Princeton, in their 2011 book, Drought,
list more than ten civilizations and cultures that probably collapsed
because of drought. Among them: The Mayans of 800 - 1000 AD. The
Anasazi culture in the Southwest U.S. in the 11th - 12th centuries.
The ancient Akkadian Empire in Mesopotamia. The Chinese Ming Dynasty
of 1500 - 1730. When the rains stop and the soil dries up, cities die
and civilizations collapse, as people abandon lands no longer able to
supply them with the food and water they need to live.


Figure 2. Ruins of the Cliff Palace at Mesa Verde National Park in
Colorado. Beginning in 1150 AD, North America experienced a 300-year
drought called the Great Drought. This drought has often been cited as
a primary cause of the collapse of the ancient Anasazi civilization in
the Southwest U.S.

The coming great droughts
We should not assume that the 21st century global civilization is
immune from collapse due to drought. If we continue on our current
path of ever-increasing emissions of carbon dioxide, the hotter planet
that we will create will surely spawn droughts far more intense than
any seen in recorded history, severely testing the ability of our
highly interconnected global economy to cope. The coming great drought
disasters will occur at a time when climate change is simultaneously
creating record rainfall and flooding in areas that happen to be in
the way of storms. Global warming puts more heat energy into the
atmosphere. That means more more water will evaporate from the oceans
to create heavier rains and make storms stronger, and there will be
more heat energy to increase the intensity of heat waves and droughts.
It all depends upon if you happen to lie on the prevailing storm track
or not which extreme you'll experience. In the future, if you're not
being cooked in a record drought, you're going to be washed away in a
record flood. Just ask the residents of the Midwest. In 2011,
residents of the Midwest endured the largest floods on record on their
three great rivers--the Mississippi, Missouri, and Ohio. In 2012, the
same region endured their worst drought since 1954, and a top-ten
warmest summer.

The nation's top scientific research group, the National Research
Council, released an 18-month study on November 9, 2012, titled,
"Climate and Social Stress: Implications for Security Analysis". They
stated: “It is prudent to expect that over the course of a decade some
climate events--including single events, conjunctions of events
occurring simultaneously or in sequence in particular locations, and
events affecting globally integrated systems that provide for human
well-being--will produce consequences that exceed the capacity of the
affected societies or global system to manage and that have global
security implications serious enough to compel international
response.” In other words, states will fail, millions will suffer
famine, mass migrations and war will break out, and national and
international agencies will be too overwhelmed to cope. We were very
lucky that the 2012 U.S. drought did not occur the year following the
great 2010 Russian drought. That drought drove up food prices to the
highest levels since 1992, and helped trigger social unrest that led
to the "Arab Spring" revolts that overthrew multiple governments.
Severe droughts in back-to-back years in major world grain-producing
areas could cause unprecedented global famine and unrest, and climate
change is steadily increasing the odds of this happening.


Figure 3. Black Sunday: On April 14, 1935 a "Black Blizzard" hit
Oklahoma and Texas with 60 mph winds, sweeping up topsoil loosened by
the great Dust Bowl drought that began in the early 1930s.

Learning from the past: the great Dust Bowl of the 1930s

"The clouds appeared and went away, and in a while they did not try anymore."
- Nobel Prize-winning author John Steinbeck in his 1939 classic, The
Grapes of Wrath, describing the weather in Oklahoma during the great
Dust Bowl drought of the 1930s.

No disaster in American history caused more suffering than the
legendary Dust Bowl drought of the 1930s, as year after year of
desperately dry conditions across the Great Plains dried out
farmlands, forcing 2.5 million people to leave their homes and seek a
better life elsewhere. At its peak in July 1934, drought conditions
covered an astonishing 80% of the contiguous U.S., making it our
largest drought ever recorded. The true cost of the drought is
impossible to calculate, but the amount of government assistance paid
out was $13 billion in today's dollars. The heat waves that
accompanied the drought killed at least 5,000 people, making it one of
the deadliest disasters in U.S. history. Fortunately, a repeat of the
dust storms and hardships of the 1930s Dust Bowl are much less likely
now, because we learned from our mistakes. In a 2009 paper titled,
Amplification of the North American "Dust Bowl" drought through
human-induced land degradation, a team of scientists led by Benjamin
Cook of the Lamont-Doherty Earth Observatory explained the situation
that led up to the Dust Bowl:

During the 1920s, agriculture in the United States expanded into the
central Great Plains. Much of the original, drought-resistant prairie
grass was replaced with drought-sensitive wheat. With no drought plan
and few erosion-control measures in place, this led to large-scale
crop failures at the initiation of the drought, leaving fields
devegetated and barren, exposing easily eroded soil to the winds. This
was the source of the major dust storms and atmospheric dust loading
of the period on a level unprecedented in the historical record.

Improved farming practices adopted after the great Dust Bowl allowed
the Midwest to endure the great multi-year drought of 1951 - 1954
without the kind of damage the Dust Bowl caused. Those improved
farming practices, in combination with the development of improved
drought-resistant grains, have helped keep the damages from the 2012
drought down. But climate change has the potential to bring far more
severe droughts to the U.S. than anything seen in American history.
The great drought of 2012 is a harbinger of the future, and we have a
significant challenge to meet if we are to continue feeding the world
in the face of intensifying droughts during the coming decades. We
need to stop the unsustainable pumping of our aquifers, move even more
aggressively to develop improved drought-resistant grains, and
practice better water conservation if we are to avoid future Dust
Bowl-scale tragedies.


Renowned documentary film maker Ken Burns debuts his new film, "The
Dust Bowl", on PBS this Sunday and Monday, November 18 and 19, 2012,
from 8 - 10 pm EST. Catch the trailer at pbs.org. It promises to be a
fascinating and highly relevant story, told by one of America's great
story-tellers.

Could ‘economic peak oil’ rival the banking crisis?


Could ‘economic peak oil’ rival the banking crisis?


http://www.rtcc.org/could-economic-peak-oil-rival-the-banking-crisis/

Last updated on 14 November 2012, 6:29 pm
nef warns that nations’ dependence on oil could cripple their economies and prices rise (Source: Damian Gadal)
‘Economic peak oil’ could cripple the world’s economies by 2014 according to a UK-based think tank, which recommends governments take urgent action to wean their economies off fossil fuels.
In its latest report the New Economics Foundation (nef) argues that the end of cheap oil, and a new age of sustained high oil prices will bring economies to a standstill, create unemployment and deepen poverty.
The Foundation argues that the threat is as real and imminent as the banking crisis which hit the developed world in 2006.
The traditional definition for peak oil is the point at which production of cheap, conventional oil peaks, plateaus and declines relative to continuing demand.
The report suggests that the case for peak oil is economically driven. Nef defines ‘economic peak oil’ as the point when the cost of supply exceeds the price economies can pay without significantly disrupting economic activity.
In its World Energy Outlook 2012, released yesterday, the International Energy Agency (IEA) revealed fossil fuel subsides increased 30% to $523 billion in 2011, hiding the threat of high oil prices.
The IEA also warned that only one-third of current proven fossil fuel reserves can be burned before the 2°C threshold of global warming is crossed – a warning to countries that they must leave these fuels in the ground.
Nef says the looming threat of ‘economic peak oil’ – which could be reached as early as 2014 or 2015 – offers another reason for countries to reduce their reliance on fossil fuels.
With limited known new sources of cheap oil and increasing efficiency being a slow progress, nef argues that the only option for limiting oil price impacts is by transitioning to a low carbon economy.
Prepared countries would continue to prosper, but this will need political leadership driving this transition, nef warns.
Read the full nef report.

Leave it in the ground


Leave it in the ground


What it will take to avoid hitting 2 degrees.  Leave 80% in the ground.  Cut 10% per year.

     Also  a speech by  Professor Kevin Anderson who says Climate scientists aren't being honest with people when they soft pedal the size of the task, and the likelihood of achieving it

"In fact, says Anderson, we are almost guaranteed to reach 4 degrees of warming, as early as 2050, and may soar far beyond that - beyond the point which agriculture, the ecosystem, and industrial civilization can survive."

----------


most recently into a missive I got from Onward Oregon this morning

The Carbon Tracker Initiative, a team of London financial analysts and environmentalists published a report for their stock investors saying that the present known reserves owned by fossil fuel companies and countries is 2,795 gigatons. This report was led by James Leaton, an advisor to the accounting giant PricewaterhouseCoopers.

To have a fighting chance of keeping the earth's climate from irreparable damage we have to keep 80% of these known reserves from ever being used. Let’s make a stand here.

how are we going to proceed? What steps and actions follow from this realization?

Here's a piece that I think cuts to the chase, lays it out more clearly than any other paper I've read.
fig_1150x4x6
The most important features of these two emergency pathways – both 350 ppm and 2°C – are their highly constrained cumulative emission budgets. Given budgets so constrained, there is not a lot of flexibility. For both pathways, keeping within budget means that a sustainable emissions peak has to come very soon. In the 350 ppm case, if emissions peak by 2011 (as in our representative pathway), then keeping within budget means subsequent emissions have to drop extremely rapidly, soon reaching an annual rate of decline of 10% per year and remaining at this rate for several decades.
Does this rate of decline sound unrealistic? Then consider that, if the 350 pathway is defined to have a global peak that’s a mere four years later – if emissions continue to rise until 2015 – then the subsequent decline would have to reach a nearly unimaginable rate of 20% per year. If, that is, we’re still to keep within the 2010 – 2050 budget of 420 gigatonnes CO2. And that, if the peak is further delayed beyond 2020, this entire remaining global carbon budget will be gone – and any even remotely plausible chance of returning to 350 ppm will be gone with it.

http://www.ecoequity.org/2009/12/a-350-ppm-emergency-pathway/  (press release)
http://gdrights.org/2009/10/25/a-350-ppm-emergency-pathway-2/  (report)


--------------


Professor Kevin Anderson

Are the climate deniers right? Are some scientists colluding with government to hide the truth about climate change? "Yes", according to top British scientist Kevin Anderson - but not the scandal you've heard about. Top scientists and government reports won't tell you we are heading toward catastrophic climate change. Emissions are skidding out of control, leading us to a world six degrees Centigrade hotter on average, much faster than anyone thought possible. Why doesn't the public know? 

Why are world conferences still talking about staying below 2 degrees, as though that is possible? 

In a devastating speech at Bristol University Tuesday November 6th, 2012, Dr. Kevin Anderson accused too many climate scientists of keeping quiet about the unrealistic assessments put out by governments, and our awful odds of reaching global warming far above the proposed 2 degree safe point.

In fact, says Anderson, we are almost guaranteed to reach 4 degrees of warming, as early as 2050, and may soar far beyond that - beyond the point which agriculture, the ecosystem, and industrial civilization can survive.

All this comes from one of the world's top climate scientists, plugged in to the latest research and numbers. Kevin Anderson is from the UK's premier climate modeling institution, the Tyndall Centre for Climate Change Research, and the University of Manchester. He delivered the speech "Real Clothes for the Emperor, Facing the Challenges of Climate Change" at the Cabot Institute of the University of Bristol in Britain.

His estimates are backed up by recent reports from the International Energy Agency, and now the global accounting firm PricewaterhouseCoopers. I also quote from Joe Romm's blog atthinkprogress.org, and a comment by Lewis Cleverdon from Wales, in the Transition blog at transitionculture.org.

I'm Alex Smith for Radio Ecoshock. In this program, I'm going to play selections from Kevin Anderson's latest speech, accompanied by some explanation and references to other sources. Anderson speaks very quickly, assuming a highly informed European audience, and includes some technical data and reports unknown to most of us. So we're going to work through this together.

2 L8 4 2D?


2 L8 4 2D?


Buckle your seat belt Dorothy
Because Kansas is going Bye Bye
- The Matrix


Greetings Peaksters

      Below Joe Romm reports on Price Waterhouse report, on the likelihood of reaching 2, based on  "decarbonization" through reduced carbon intensity -  Its pretty clear that's not going to be enough.  In fact:

"Even to have a reasonable prospect of getting to a 4°C scenario would imply nearly quadrupling the current rate of decarbonisation."

As you may recall  the 4 degree world is not that great.    You might even say its

 “incompatible with organized global community, is likely to be beyond ‘adaptation’, is devastating to the majority of ecosystems & has a high probability of not being stable (i.e.  4°C [7°F] would be an interim temperature on the way to a much higher equilibrium level,” 


Such a world would likely mean:
  • Permanent Dust Bowl conditions over the U.S. Southwest, parts of the Great Plains and many other regions around the globe that are heavily populated and/or heavily farmed.
  • Sea level rise of some 1 foot by 2050, then 4 to 6 feet (or more) by 2100, rising some 6 to 12 inches (or more) each decade thereafter
  • Massive species loss on land and sea — perhaps 50% or more of all biodiversity.

-------
Also, here's a nicely done article by Anderson explaining what it might really take


The disastrous collapse of the Soviet Union triggered ( 5 per cent year-on-year emission reductions
for about 10 years – a rate just half to a quarter of what is necessary to give us a 50:50chance of achieving the 2°C goal (Anderson and
Bows, 2008). 

------------


new report by PricewaterhouseCoopers finds humanity has its foot on the accelerator as we head toward a cliff. The only hope is very rapid deployment of  carbon-free technology starting ASAP.
The title of the PWC report is sobering, “Too late for two degrees?” So is its main conclusion:
Our Low Carbon Economy Index evaluates the rate of decarbonisation of the global economy that is needed to limit warming to 2oC. This report shows that global carbon intensity decreased between 2000 and 2011 by around 0.8% a year. In 2011, carbon intensity decreased by 0.7%. The global economy now needs to cut carbon intensity by 5.1% every year from now to 2050. Keeping to the 2oC carbon budget will require sustained and unprecedented reductions over four decades.
Governments’ ambitions to limit warming to 2oC appear highly unrealistic.
Here are two more conclusions that can kill — or maybe cause — a hangover:
We have passed a critical threshold – not once since 1950 has the world achieved that rate of decarbonisation in a single year, but the task now confronting us is to achieve it for 39 consecutive years….
Even to have a reasonable prospect of getting to a 4°C scenario would imply nearly quadrupling the current rate of decarbonisation.
Despite the many hand-wavers who assert the optimal climate strategy is more research and development, this is yet another independent analysis that makes crystal clear such a do-little approach would be suicidal (see “Study Confirms Optimal Climate Strategy: Deploy, Deploy, Deploy, R&D, Deploy, Deploy, Deploy“).
It bears repeating that warming of 7°F or beyond is “incompatible with organized global community, is likely to be beyond ‘adaptation’, is devastating to the majority of ecosystems & has a high probability of not being stable (i.e.  4°C [7°F] would be an interim temperature on the way to a much higher equilibrium level,” as climate expert Kevin Anderson explains here. Tragically, that appears to be the likely outcome of business as usual.
No wonder the report states bluntly:
The only way to avoid the pessimistic scenarios will be radical transformations in the ways the global economy currently functions: rapid uptake of renewable energy, sharp falls in fossil fuel use or massive deployment of CCS, removal of industrial emissions and halting deforestation. This suggests a need for much more ambition and urgency on climate policy, at both the national and international level.
Either way, business-as-usual is not an option.
Leo Johnson, PWC’s Partner for Sustainability and Climate Change, rather dryly concludes his letter introducing the report:
Business leaders have been asking for clarity in political ambition on climate change. Now one thing is clear: businesses, governments and communities across the world need to plan for a warming world – not just 2ºC, but 4ºC and, at our current rates, 6ºC.
Of course, planning for 4°C [7°F] in 2100 — let alone 6°C [11°F] — is tantamount to planning for the end of civilization as we know it (see this review of more than 60 recent studies — “An Illustrated Guide to the Science of Global Warming Impacts: How We Know Inaction Is the Gravest Threat Humanity Faces“).
Such a world would likely mean:
  • Permanent Dust Bowl conditions over the U.S. Southwest, parts of the Great Plains and many other regions around the globe that are heavily populated and/or heavily farmed.
  • Sea level rise of some 1 foot by 2050, then 4 to 6 feet (or more) by 2100, rising some 6 to 12 inches (or more) each decade thereafter
  • Massive species loss on land and sea — perhaps 50% or more of all biodiversity.
  • Much more extreme weather
These will all be happening simultaneously and getting worse decade after decade. A 2009 NOAA-led study found the worst impacts would be “largely irreversible for 1000 years.”
In such a world there would be little prospect for feeding 9 billion people post-2050 given current dietary, economic, and agricultural practices. The word “adaptation” simply doesn’t apply in any meaningful sense:
Of course, there is every reason to believe that the earth would just keep getting hotter and hotter:
Steve Easterbrook’s post “A first glimpse at model results for the next IPCC assessment” shows that for the scenariowhere there is 9°F warming by 2100, you get another 7°F warming by 2300. Of course, folks that aren’t motivated to avoid the civilization-destroying 9°F by 2100 won’t be moved by whatever happens after that.
As I said, humanity has its foot on the accelerator as we head toward a cliff. This climactic climatic cliff makes the much-talked-about fiscal cliff seem like a bump in the road. Yet here we are on election day after a campaign with relentless silence on climate issues. The “Slowly Boiling Brainless Frogs” live — for now.

Dependent on the kindness of strangers


Dependent on the kindness of strangers


So, we are hearing a lot about "energy Independence". And  with good reason.    Good reason?   What I mean is that the US uses a lot of gasoline and diesel, but doesn't produce that much.   So, being  _dependant_ in the kindness of strangers is something to be concerned about.  

     As far as US production, goes, Professor Tad Patzek, breaks the numbers down.  (see below) 

    The important number is crude - because crude can be turned into gasoline and diesel   That number has ticked up slightly  thanks to tight shale,  , but the total still only amount to 6 mb/d  - which is still only about 1/3 of what the US consumes.  

    The alleged increases in production are made by adding in "other" hydrocarbons : ethanol (1.1 mb/d), refinery gains(0.9) and Natural gas liquids (NGLs) (2.9).  As you can see, more than half are NGL's.    But, NGLs, are not used in transportation.  And transportation is what we are concerned about.   http://www.econbrowser.com/archives/2012/07/natural_gas_liq.html

   So ,even  taking ethanol and refinery gains at face value, the US still only produces a total 8 mmB/yr - not even 1/2 of what it uses (18.8 mb/d in 2011).   And that situation is not likely to change   Patzek show the likely impact of new fields coming on, including tight shale, as well as potential Alaskan oil. They are slight blips on the curve, which continues to head down    

   So, the idea that we don't have to worry about importing oil doesn't really hold up. 

   What about our friendly exporters?  Well right here in North America we've got Mexico (1.5 mb/d) and Canada (2.3mb/d).  We can count on them, right?   Maybe.     But Mexico is struggling,   and may cease to export _any_oil after 2020.  http://money.cnn.com/2012/08/17/news/economy/mexico-oil/index.html

      And Canada is kind of an odd case as well. Strangely enough, Canada is barely a net exporter at all.  It produces 2.9 mmb/yr, but consumes 2.3!     So, although its sending oil to the US, it has to import oil to make up for it.    Because of geography, it has to import oil for the east coast, while selling oil to the US from the center of the country.     Now, fast forward to the future -  at what price will it make more sense to send to oil east, rather than south?   http://resourceinsights.blogspot.com/2011/11/why-isnt-keystone-pipeline-extension.html
     So where does Canada get its imported oil?   Saudi Arabia, Africa and Venezuela.     Those are nice stable places, right?    No risk there.  !!!  (see below)

     So, bottom line,  for the foreseeable future,  the US will continue to import about 1/2 of what it uses.   Maybe Canada will help a little.  

     Which brings us to the question of the future of oil exports generally.    Currently about 42 mbb/d is available on the export market.  Five producers account for about 1/2 of that amount : Saudi Arabia, Russia, Iran UAE, and Norway.   But their current exports are beginning to decline, due to lower production  as well as more use at home.   Based on current trends,  by 2020, their combined exports may drop my 65% , from 21 mb/d to 7.5 mb/d.  http://www.cgstrat.org/documents/Oil_Export_Declines_by_2020_v1.1.1_10_May_2012.pdf

    Currently the oil on the market is "rationed" on the basis of price.  China and India bid more, and end up using more, while the western countries use less.    If this trend were to continue.  oil available to the west could drop precipitously. - by 2020, it could drop by 50% or more.


Inline image 1
Is there a silver lining?  :  Perhaps a disruption in the oil economy will provide some respite from the seemingly unstoppable march, to burn everything , 


"So we’re left with this sad truth: Likely the only thing that will save our species (and all species) from climate catastrophe at this point is a global collapse of the industrial economy -- beginning in the next few years and progressing rapidly to an extremely low level of technological complexity.
The 6% annual decrease in CO2 emissions modeled by Hansen dictates that emissions get halved about every twelve years. That’s what we need. And we might even need it faster. Tipping points loom large and dark – still partially concealed in the mists of complexity, but there nonetheless.     


--------------
     Peak, What Peak?

by Tad Patzek
[Editor's comment: This article is by Dr. Tad Patzek, chairman of the Department of Petroleum & Geosystems Engineering at The University of Texas at Austin. Dr. Patzek's research involves mathematical modeling of earth systems with emphasis on multiphase fluid flow physics and rock mechanics. He is also working on smart, process-based control of very large waterfloods in unconventional, low-permeability formations, and on the mechanics of hydrate-bearing sediments. In a broader context, Patzek works on the thermodynamics and ecology of human survival and energy supply schemes for humanity. He has participated in the global debate on energy supply schemes by giving hundreds of press interviews and appearing on the BBC, PBS, CBS, CNBC, ABC, NPR, etc., and giving invited lectures around the world. This article first appeared on Tad's blog Life Itself.]
Before I discuss the logic behind negating a peak of production of anything, let me sum up where we are in the U.S. in terms of crude oil production.  According to the Energy Information Administration (EIA):
The United States consumed 18.8 million barrels per day (MMbd) of petroleum products during 2011, making us the world's largest petroleum consumer. The United States was third in crude oil production at 5.7 MMbd. But crude oil alone does not constitute all U.S. petroleum supplies. Significant gains occur, because crude oil expands in the refining process, liquid fuel is captured in the processing of natural gas, and we have other sources of liquid fuel, including biofuels. These additional supplies totaled 4.6 MMbd in 2011.
Let me parse this quote.
First, let's look at the history of oil production in the U.S., shown in the chart below.  The vertical axis is scaled with a unit of power, exajoules (EJ) per year, very close to quadrillion BTUs (quads) per year.  To convert from EJ/year to millions of barrels of crude oil per day (MMbopd), divide the vertical axis by roughly two, so 20 EJ/year is roughly equal to 10 MMbopd.

Historic production of crude oil in the U.S. is resolved into several Hubbert curves.  The tallest one is the original Hubbert curve published in 1956.  The smaller curves starting from 1960 were generated by producing shallow, deep and ultra-deep Gulf of Mexico, Alaska (mostly Prudhoe Bay), and then everything else that was not in the original curve: large waterflood projects, thermal and carbon dioxide enhanced oil recovery (EOR) projects, horizontal wells, hydrofractured wells, etc.  The broad curve peaking in 2002 was introduced in late 2002, and the model represented fairly well the U.S. crude oil production until 2010.  The last small green curve on the right was introduced last month to describe the Bakken and Eagle Ford shales, as well as the increased production of crude oil from the Permian Basin near Midland, TX.  The right-most black curve depicts a hypothetical production of 7 billion barrels of oil from the Arctic Natural Wildlife Refuge (ANWR) in Alaska.  So the last point on the blue step-line represents 5.7 MMbopd produced in the U.S. in 2011. This rate is predicted by EIA to grow to over 6 MMbopd in 2012.

Now, let's look at the refinery gains in the second chart. These gains arise because petroleum products are usually less dense than the crudes they are made from. Therefore, refinery gains are not really a replacement of imported crude oil, and demonstrate only that since 1993, the U.S. refining has been moving towards heavier crude oil feedstocks.

Oil refinery gains reported by EIA since 1993 hover around 1 million barrels of all petroleum products per day.  These gains arise because the densities of petroleum products (gasoline, kerosene, diesel fuel, jet fuel, heating oil, etc.) are less than the density of crude oil they were made from.  It is like making a low calorie butter or cheese from a normal butter or cheese by puffing them up with bubbles of air.  Through refinery gains, we have not created new energy. Instead, we have just puffed up the crude oil feedstock by cracking heavier hydrocarbons and hydrogenation. Thus, refinery gains do not really count as a new source of energy, but only as a source of an increased volume of petroleum products.
Corn ethanol comes next.  I described the ethanol story completely in 2004, in my most popular paper ever. There was nothing new I would add in the intervening 8 years. Basically, ethanol is obtained from burning methane, coal, diesel fuel, gasoline, corn kernels, soil and environment. We destroy perhaps as many as 7 units of free energy in the environment and human economy to produce 1 unit of free energy as corn ethanol, and make a few clueless environmentalists happier and a few super rich corporations richer. The story is even worse for switchgrass ethanol. Finally, your mileage would drop by 33% if you were to use pure ethanol as a fuel for your car.


Production of corn ethanol in the U.S.  Because ethanol has a lower heating value, its volume would be much lower when converted to equivalent crude oil. 


Production of soybean biodiesel in the U.S. is too low to get excited.

Production of soybean biodiesel in the U.S. is almost irrelevant, but alsohighly environmentally damaging. Since most of the obliteration of the irreplaceable biota occurs in the tropics, in Brazil, Argentina, Africa, and Asia Pacific, we really don't care.  Either way, the rate of biodiesel production in the U.S. is too low to write home about it.
In summary, of the 4.6 million barrels of the other "oil"  produced in 2011, 1.1 MMbopd were refinery gains, and another 0.6 MMbopd was the equivalent volume of oil corresponding to the production of roughly 0.9 MMbpd of ethanol.  Biodiesel production was in the noise. I fear that EIA simply added volumes of the various fuels without converting them to oil equivalents based on a common oil density and heating value. The rest of the other "oil", 2.9 or 2.6 million barrels of oil equivalent (again I do not know how EIA made their conversions) were natural gas plant liquids and lease condensate.  All of these liquids are significantly less dense than crude oil, and a proper conversion lowers their volume contribution by 25 percent.
Needless to say, refinery gains do not inject new energy into the U.S. economy, just add volume. Also, propane and butane are not crude oil, and ethanol is not a hydrocarbon. The only hard number here, 5.7 MMbopd of crude oil production is something to write home about.  This level of production requires an incredible amount of new technology and technical skills that are available only in the U.S. My department graduates each year about 150 petroleum engineers of all levels, who make this huge effort such a smashing success. Their starting salaries are in excess of three-four times the national average for college graduates. And they all have jobs.
In conclusion, Russia is using similar technology to increase their rate of crude oil production to over 11 MMbopd, and Saudi Arabia is barely hanging in at 9-10 MMbopd.  Both these countries also produce large volumes of lease condensates and natural gas plant liquids. The rate of U.S. crude oil production is a little more than 1/2 of either of these two rates, and we are no Russia or Saudi Arabia when it comes to producing oil per unit time. But this is just fine, so let's stop deluding ourselves with such tenacity.
In the next blog, I will talk about the various techniques of denying existence of peak oil (or climate change, or anything else we fear or do not like).
P.S.  So, did I miss anything in my discussion of the EIA quote at the top of this blog?  Think carefully... Yes, I did.
In 2011, we consumed 18.8 MMbpd of petroleum products, less by 1.6 MMbpd than our consumption of petroleum products in 2005.  With less cash in pocket, less driving, and more efficient cars, we have destroyed demand for almost as much of real crude oil as all other imaginary "oils" quoted by EIA and dutifully propagated through the clueless mediadom.
Why isn't this achievement front-page news?  We finally use less crude oil!  We are more efficient! This incredible news is evidently not as sexy as making up imaginary "oil" to be on par with the Saudis. Have we gone mad?!  I take it back: Have we stumbled even deeper into the destructive imperial madness that has infected us for the last 11 years?
And, you, corn ethanol lovers, read this and fear the future.
P.S.P.S.  Five years after my well-researched plea to the EU Ministers of Environment and Transportation, EU is considering limiting use of biofuels:
The European Commission intends to limit the use of biofuels derived from food crops to 5% for transport fuel. This would be a substantial change to its present biofuels policy. According to the EU’s climate-change and energy commissioners, Europe wants to cap the share of energy in the transport sector from food crop-based biofuels at current levels. The proposal, a draft of which was reported by Dow Jones Newswires, clashes with the target of having 10% of the energy used in transport coming from renewable sources by 2020. This goal was set by the EU three years ago because food crop-based biofuels account for most biofuels available in volumes at the moment. New types of alternative fuels are being developed, but they are mostly at the laboratory stage. At the same time, biofuels are expected to be the main renewable energy source used in transport in 2020.
Despite the obvious insanity of the last sentence, I say: Better late than never, dear Europe, and much better than the U.S.A., which seems to have a policy of accepting political donations from mega agricultural companies and all kinds of other companies, rather than having an energy policy.
(P.S.)-cubed on 11/13/2012. The Wall Street Journal insists on an alternative reality view of EIA reporting, by stating in a Review&Outlook piece, "Saudi America," that:
The U.S. will increase its production to about 23 million barrels a day in 10 years from about 18 million barrels a day now, the IEA predicts.
I have no idea what IEA predicts, but I surely know that this number is incorrect, if it implies current production of liquid hydrocarbons in the U.S.A