Friday, February 27, 2015


Hand me down my soup and fish
I'm going to get just what I wish
    - Perry como ( 1950) 
One fish  two fish
   - P J Harvey (1995)
Greetings
         William Catton's "Overshoot" was one of the most influential books I have read.  He blended together, ecology, anthropology, and sociology in a clear exposition of where we are and how we got here.   Professor Catton died last week.  Below is a nice piece on his work. (William Catton's Warning)
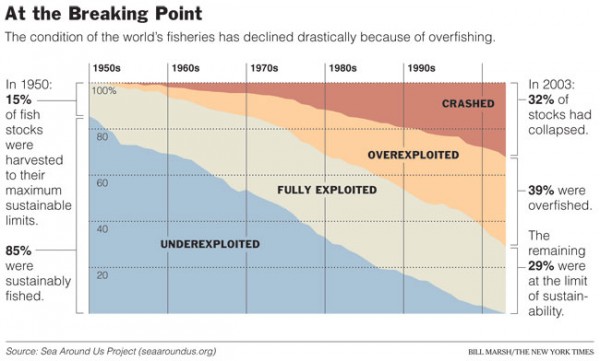
        I was born in 1949.    I was raised by the shore.  Fish and fishing were a normal part of everyone's life.   This chart blows my mind.   In 1950 85% of fishing was sustainable.
       Now it's 0%     In one lifetime.

  Of course, fishing is just one of many areas that have come under pressure .   Take a look at these graphs, from this recent paper:  The trajectory of the Anthropocene: The Great Acceleration    
"It is difficult to overestimate the scale and speed of change. In a single lifetime humanity has become a planetary-scale geological force,” says lead author Professor Will Steffen, who led the joint project between the International Geosphere-Biosphere Programme (IGBP) and the Stockholm Resilience Centre.
Lots of "hockey sticks": Great Acceleration Slide Show


--------

William Catton's warning

William Catton Jr., author of the seminal volume about our human destiny, Overshoot: The Ecological Basis of Revolutionary Change, died last month at age 88.
Catton believed that industrial civilization had sown the seeds of its own demise and that humanity's seeming dominance of the biosphere is only a prelude to decline. His work foreshadowed later works such as Joseph Tainter's The Collapse of Complex Societies, Richard Heinberg's The Party's Over: Oil, War and the Fate of Industrial Societies, and Jared Diamond'sCollapse: How Societies Choose to Fail or Survive.
In Overshoot Catton wrote: "We must learn to relate personally to what may be called 'the ecological facts of life.' We must see that those facts are affecting our lives far more importantly and permanently than the events that make the headlines."
He published those words in 1980, and now, it seems, at least some of those facts have made their way into the headlines in the form of climate change, soil erosion, fisheries collapse, species extinction, constrained supplies of energy and other critical resources, and myriad other problems that are now all too obvious.
But, even today, few people see the world as Catton did. Few realize how serious these problems are and how their consequences are unfolding right before us. Few understand what he called "the tragic story of human success," tragic because that success as it is currently defined cannot be maintained and must necessarily unwind into decline owing to the laws of physics and the realities of biology. We can adjust to these realities or they will adjust us to them.
Perhaps the single keenest insight Catton had is that humans have become detritovores, organisms that live off the dead remains of other organisms. By this he meant the human dependence on fossil fuels which are the ancient dead remains of organisms transformed into oil, natural gas and coal.
It is the fate of detritovore populations to expand and contract with their supply of detritus. He likened modern humans to algae feeding on the rich surplus of nutrients from dead organic matter swept into a pond by spring rains and often multiplying so as to cover the entire pond with a green carpet. By summer, with the rush of spring nutrients depleted--nutrients which are like the one-time infusion of fossil fuels into human society--the algae population crashes, leaving mostly open water and sometimes just an uneven ribbon along the edge of the pond. It is a boom-bust population cycle well-known to biologists.
In 1980 it seemed as if this cycle might be mitigated by wise policy and serious, but achievable adjustments in the human way of life. By 2009 when Catton published his other book, Bottleneck: Humanity's Impending Impasse, he felt that the time for major mitigation of the inevitable bust portion of the population cycle had passed.
So, why even write another book? Catton explained in the last paragraph of Bottleneck:
I hope by the time [my great-grandsons] become great-grandfathers themselves, their generation will be so conspicuously more enlightened than mine was and our forebears were that the world population of bottleneck survivors will have evolved social systems better able to be circumspect in the use of their planet and its vulnerable biosphere. If readers of this book come to share similar hopes, and contribute to instilling them in their descendants, my reasons for writing will have been justified.
This is a humble ambition compared to the cautious hope that flowed from Overshoot in 1980. And, it is important to note Catton's emphasis on social systems for he was trained as a sociologist. He believed that despite our considerable technical prowess, our social system simply cannot contemplate making the drastic changes necessary to mitigate the downslope.
Perhaps the most important thing to note about Catton is that he did not blame anyone for the human predicament. To him that predicament is the natural outcome of evolutionary processes and the powers given to humans through those processes. That predicament is no more a product of conscious thought and intention than is the beating of our own hearts.
When I met and chatted with him for the one and only time in 2006, he was mildly jocular in the same way that his writing is, and he was upbeat in his attitude toward daily life, however disturbing the future may seem.
That was probably the product of a life spent in deep and patient study of the world around him, a world that yielded some its most hidden and important secrets to him. And, he had the satisfaction of having published those secrets so that they would not be secrets any more.
Overshoot may stand as the central text of the 20th century about the ecological fate of humankind. The book represents a missed opportunity in that so few people were able to hear what Catton had to say in 1980, and so few want to hear it now--even as the headlines are filled with the very precursors of the bottleneck he laments in his last major piece of writing.

Labels: , ,

Monday, February 23, 2015

Trouble with the curve


What goes up
Must come down
    - Blood Sweat and Tears

I'm coming down fast
   - John Lennon ( Helter Sketer)


Greetings
        Ugo Bardi  has a done a few recent posts addressing his model for the decline in oil production after a peak.    He suggests that the curve may not have the same shape going down as it did going up, in line with a statement by Seneca:
"It would be some consolation for the feebleness of our selves and our works if all things should perish as slowly as they come into being; but as it is, increases are of sluggish growth, but the way to ruin is rapid."

        One real life illustration of this phenomenon can be seen in the context of fishing harvests, which go along fine, and then crash.   Bardi suggest that the the rapid decline after the peak is caused by the response of the fishing industry to m a situation where it is harder and harder to find the fish -   an increased investment in fishing  boats.  seehere  He says:
   "There are several historical examples of the Seneca cliff; in the case of fisheries, it is especially evident in the case of the Canadian cod fishery and for the Caspian Sturgeon; but it is evident also in the case of the UK fishing industry. Note, in the figure above, the steep decline of the landings of the late 1970s, it is significantly steeper than the growth of the left side of the curve. This is the essence of the Seneca mechanism. And we can see very well what causes it: the start of the decline in production corresponds to a rapid growth of investments. The result is the increase of what the authors of the paper call "fishing power" - an estimate of the efficiency and size of the fishing fleet.
        Which brings us to decline rates for oil.    The post peak decline rate of an oil field is not a fixed thing.  It is depends on the way the field is developed and operated.  Using enhanced oil recovery techniques, one can take more in the early years, but at the expense of a steeper decline at the end.    A very interesting paper  called, "Giant oil field decline rates and their influence on world oil production",  provides an excellent review of the way that decline rates may vary.
"Prolonged plateau levels and increased depletion made possible by new and improved technology result in a generally higher decline rates. Detailed case studies of giant oilfields suggest that technology can extend the plateau phase, but at the expense of more pronounced declines in later years (Gowdy and Juliá, 2007)."
      One chart , Table 4, (which i can't figure out how to copy) shows how the decline rates have increased over time.  Land based fields which plateaued in the 1960's declined at -4.2%,  in each succeeding decade the decline rate increased, and by the 2000's the rate was -10.7%..  The off shore fields were even more dramatic. see Table 5.  There was divergence between OPEC and non-OPEC fields, which was presumably caused by the difference in philosophy between for profit corporations, and state run operations.  However even OPEC fields are showing increasing decline rates in the 1990's and 2000's.     
       Thus, the fields which were developed first have lowest decline rate, once they peak.    At that point we will be relying on the growth in the later fields.    When these later fields peak , things get interesting, because their decline rates drag down the total.    We can vividly see this with the fracking, which is the only development keeping the total production from peaking.   The decline rate for fracked wells is very large, averaging between 60-90% in the first three years.l.     
      Initially, the post peak decline is slow, as it is a blend of declining fields with fields which are growing, or at least not declining.  Hirsch suggested in his report, that we could reasonable adapt to decline rate of 2%, but that 5%, would trigger a recession.    
 For perspective, it's useful to know that IEA estimates that even with additional capital spending the decline   rate for all fields is   6.7%  for post peak fields.   Otherwise it would be 9.0%
       As we know, capital spending is way down right now due to the precipitous drop in oil prices. 
I'll close with this quote from an executive at Total, the French oil company , from a few days ago.  See here
””There is a natural decline of five percent a year from existing fields around the world. That means by 2030 more than half of the existing global oil production will disappear. There is an enormous amount of money that needs to be invested to get another 50 million barrels per day of new production

Labels: , , ,

Friday, February 20, 2015


I'm a political man
And I practice what I preach
   -Cream

Give em what they want
    -10,000 maniacs

Greetings
       Here 's an interesting article by Michael Klare which illustrates  clever cooperation between neo cons worried about Russia, with climate deniers promoting tar sands and fracking.  One nice "hook" for them is the idea of an enemy - a very powerful psychological tool,  in the propaganda business.
       Meanwhile ,on the other side, we see a struggle to find a unity of interest.   Poor working people are righfully cautious in embracing " degrowth"  Making the planet habitable in 2100, is nice.  But putting food on the table today seems more important.
       I've starting watching the video from the Coursera "sustainable development" course.    Its put on by Columbia University and is free.    So far, they've set out the goals of being wealthy, having a fair distribution, and ecological responsibility.  I'm looking forward to seeing how they get there.

Labels: , , ,

Wednesday, February 18, 2015


Two can be as bad as one
It's the loneliest number
since the number one
     - Three Dog Night

Two of us, riding nowhere
   
     -John Lennon

Greetings

     Here's a nice post from David Spratt of  Climate Code Red.   It demonstrates that there has been no " pause"   In warming, but that 2014, is right on track.    He also explains how Michael Mann has come to the conclusion that, if we continue with current emissions, we are likely to see 2 degrees by 2036.   That' s  only 21 years away !   (if I did my arithmetic correctly.)

      However, it looks like, even if we "turned all the knobs to the left",  and emitted no carbon starting tomorrow, we would still hit 2 degrees, but perhaps a little later.  This is because the carbon already in the pipeline will add another .5 degrees,  and the loss of the cooling by the aerosols will add another 1 degree. When added to the .8 we are already experiencing, we slide into 2 degrees some time this century.

     But of course, even .8 has some problems.  see e.g.  Boston has snowiest month on record  Why Bigger Snowstorms come with Climate Change     


     http://www.climatecodered.org/2015/02/two-degrees-of-warming-closer-than-you.html


---------

Two degrees of warming closer than you may think

by David Spratt

It's taken a hundred years of human-caused greenhouse emissions to push the global temperature up almost one degree Celsius (1C°), so another degree is still some time away. Right?  And there seems to have been a "pause" in warming over the last two decades, so getting to 2C° is going to take a good while, and we may have more time that we thought. Yes?

Wrong on both counts.  

The world could be 2C° warmer in as little as two decades, according to the leading US climate scientist and "hockey stick" author, Dr Michael E. Mann. Writing in Scientific American in March 2014 (with the maths explained here), Mann says that new calculations "indicate that if the world continues to burn fossil fuels at the current rate,global warming will rise to 2C° by 2036" and to avoid that threshold "nations will have to keep carbon dioxide levels below 405 parts per million", a level we have just about reached already.  Mann says the notion of a warming "pause" is false.

Global temperature over the last 1000 years: the "hockey stick"

Here's why 2C° could be just 20 years away.

Record heat

2014 was the hottest year in the instrumental record. The US government agencies NASA and NOAA announced the 2014 record on 16 January, noting that "the 10 warmest years in the instrumental record, with the exception of 1998, have now occurred since 2000". 


NASA's Goddard Institute for Space Studies (GISS) says that since 1880, "Earth’s average surface temperature has warmed by about 1.4 degrees Fahrenheit (0.8C°), a trend that is largely driven by the increase in carbon dioxide (CO2)  and other human emissions into the planet’s atmosphere. The majority of that warming has occurred in the past three decades."

GISS Director Gavin Schmidt says that this is “the latest in a series of warm years, in a series of warm decades. While the ranking of individual years can be affected by chaotic weather patterns, the long-term trends are attributable to drivers of climate change that right now are dominated by human emissions of greenhouse gases".

2014 was also Australia’s third-hottest year on record, according to the Bureau of Meteorology: "Overall, 2014 was Australia's third-warmest year on record: the annual national mean temperature was +0.91 °C above average…  All States, except the Northern Territory, ranked in the four warmest years on record." 

The 2014 record was achieved in neutral ENSO conditions

Fluctuations in the ENSO cycle affect global temperature, with El Niño conditions (a mobile blister of Pacific Ocean heat that affects wind patterns and currents and reduces rainfall in eastern Australia) correlating with warmer global temperatures. Former NASA climate science chief Dr James Hansen and colleagues note that the record global temperature in 2014 "was achieved with little assistance from the tropical ENSO cycle, confirms continuing global warming...  and with the help of even a mild El Niño 2015 may be significantly warmer than 2014."

And El Niño conditions are likely to became more frequent with more warming. Last year, Wenju Cai, a climate researcher for Australia’s Commonwealth Scientific and Industrial Research Organisation (CSIRO), warned that the frequency of extreme El Niño events could double with climate change, in a paper that presented "evidence for a doubling in the occurrences in the future in response to greenhouse warming".

There is no "pause" in warming

In releasing the data on 2014's record warmth, NASA charted warming since 1970 and demonstrated that there has been no "pause" or slowing in warming, contrary to the million-times-repeated claims of the climate warming denial industry.

Joe Romm of Climate Progress says this chart (below) shows that: "The human-caused rise in surface air temperatures never paused, never even slowed significantly. And that means we are likely headed toward a period of rapid surface temperature warming. "


A year ago, Prof Matthew England of University of NSW suggested that temperatures were likely to rise quickly:
Scientists have long suspected that extra ocean heat uptake has slowed the rise of global average temperatures, but the mechanism behind the hiatus remained unclear…. But the heat uptake is by no means permanent: when the trade wind strength returns to normal –- as it inevitably will –- our research suggests heat will quickly accumulate in the atmosphere. So global [surface] temperatures look set to rise rapidly….
The oceans are warming very rapidly

Of all the additional heat trapped by higher levels of greenhouse gases, more than 90 per cent goes to warming the oceans, and thus ocean heat content (OHC) is by far the most significant and reliable indicator of global warming. By contrast only two per cent goes to warming the atmosphere, so small heat exchanges between oceans and the atmosphere (caused by changing sea surface, ocean circulation and wind conditions) can have a significant impact on atmospheric temperature, but not on ocean temperature.

The NOAA's State of the Climate for 2014 reports:
During 2014, the globally-averaged sea surface temperature was 1.03°F (0.57°C) above the 20th century average. This was the highest among all years in the 1880-2014 record, surpassing the previous records of 1998 and 2003 by 0.09°F (0.05°C).

The rate of OHC incease appears to be accelerating, with Romm noting that:
... ocean warming has sped up, and sea level rise has accelerated more than we thought, and Arctic sea ice has melted much faster than the models expected, as have the great ice sheets in Greenland and Antarctica.
And as Matthew England has told us, when the trade wind strength returns to normal, some ocean heat will quickly accumulate in the atmosphere.

You can check all the NOAA ocean heat content charts here.

Human greenhouse gas emissions are not slowing

Data from the Global Carbon Project shows annual carbon dioxide emissions are continuing to increase, and that the rate of increase since 2000 is at least double that of the 1990-99 decade. Emissions are projected to continue on the current growth path till 2020.
Fossil fuel emissions 1990-2014 and projected to 2019
To summarise the story so far: 2014 was a record hot year (without El Nino conditions); there has been no pause in warming; ocean heat content is rising at an increasing rate; global annual carbon dioxide emissions are continuing to grow; and more frequent El Nino conditions and a return to more normal trade wind strength will release some ocean heat to the atmosphere; so we are likely headed for a period of rapid surface temperature warming.

But there is more to the story.

A reservoir of heat already in the system 

Increased levels of atmospheric greenhouse gases create an energy imbalance between incoming and outgoing radiation, which is resolved by elements of the earth system (land and oceans) absorbing the additional heat until the system reaches a new balance (equilibrium) at a higher temperature. But that process takes time, due to thermal inertia (as with an electric oven: once energy is applied, it takes time for all the structure to heat up and is not instantaneous).  As a rule of thumb, about one-third of the heating potential of an increase in atmospheric carbon dioxide will be felt straight away, another third take around 30 years, and the last third is not fully realised for a century.

Thus there is more warming to come for the carbon dioxide already emitted, amounting to about another 0.6°C of warming.  And because the rate of emissions is increasing, that figure is also increasing.

From this we can conclude that around 1.5°C of warming is locked into the system for current CO2 levels, though very large-scale carbon drawdown could reduce levels slowly over decadal time frames.

As well as long-lived CO2, there are other greenhouse gases with shorter lifetimes, particularly methane (lifetime approx. 10 years) and nitrous oxide (lifetime approx. 100 years). Because emissions of these gases are also continuing unabated, they also contribute to warming temperatures on decadal time frames.

In fact, the current level of greenhouse gases if maintained is already more than enough to produce 2°C of warming over time: in 2008 two scientists, Ramanathan and Feng, inOn avoiding dangerous anthropogenic interference with the climate system: Formidable challenges ahead found that if greenhouse gases were maintained at their 2005 levels, the inferred warming is 2.4˚C (range 1.4˚C to 4.3˚C).

The current level of greenhouse gases is around 400 parts per million (ppm) CO2, and 470 ppm CO2 equivalent (CO2e) when other greenhouse gases are included. The last time CO2 levels were as high as they are today, humans didn't exist, and over the last 20 million years such levels are associated with major climate transitions. Tripati, Roberts et al. found that, big changes in significant climate system elements such as ice sheets, sea levels and carbon stores are likely to occur for the current level of CO2:
During mid-Miocene climatic optimum [16-14 million years ago] CO2 levels were similar to today, but temperatures were ~3–6°C warmer and sea levels 25 to 40 metres higher than at present… When CO2 levels were last similar to modern values (greater than 350 ppmv to 400 pmv), there was little glacial ice on land, or sea ice in the Arctic, and a marine-based ice mass on Antarctica was not viable…
But the question remains as to how quickly this warming will occur, and for that we need to look at two further factors: climate sensitivity and the role of aerosols.

Climate sensitivity

The measure of how much warming occurs for an increase in greenhouse gases is known as climate sensitivity, and is expressed as the temperature rise resulting from a doubling of greenhouse gas levels. 

As Michael E. Mann explains:
Although the earth has experienced exceptional warming over the past century, to estimate how much more will occur we need to know how temperature will respond to the ongoing human-caused rise in atmospheric greenhouse gases, primarily carbon dioxide. Scientists call this responsiveness “equilibrium climate sensitivity” (ECS). ECS is a common measure of the heating effect of greenhouse gases. It represents the warming at the earth's surface that is expected after the concentration of CO2 in the atmosphere doubles and the climate subsequently stabilizes (reaches equilibrium)… The more sensitive the atmosphere is to a rise in CO2, the higher the ECS, and the faster the temperature will rise. ECS is shorthand for the amount of warming expected, given a particular fossil-fuel emissions scenario.
As discussed previously here, some elements of the climate system respond quickly to temperature change, including the amount of water vapour in the air and hence level of cloud cover, sea-level changes due to ocean temperature change, and the extent of sea-ice that floats on the ocean in the polar regions. These changes amplify (increase) the temperature change and are known as short-term or “fast” feedbacks, and it is on this basis that (short-term) ECS is well established as being around 3°C for a doubling of greenhouse gas levels (see, for example, Climate sensitivity, sea level, and atmospheric carbon dioxide).

But there are also longer-term or “slow” feedbacks, which generally take much longer (centuries to thousands of years) to occur. These include changes in large, polar, land-based ice sheets, changes in the carbon cycle (changed efficiency of carbon sinks such as permafrost and methane clathrate stores, as well as biosphere stores such as peat lands and forests), and changes in vegetation coverage and reflectivity (albedo). When these are taken into account, the sensitivity is significantly higher at 4.5°C or more, dependent on the state of the poles and carbon stores. Importantly, the rate of change at present is so fast that some of these long-term feedbacks are being triggered now on short-term timeframes (see Carbon budgets, climate sensitivity and the myth of "burnable carbon").

Mann says uncertainty about ECS can arise from questions of the role of clouds and water vapour, with the most recent IPCC report simply giving a range of 1.5–4.5°C but no "best-fit" figure. Factors such as changing rates of heat flux between oceans and atmosphere (including the El Nino/La Nina cycle), and volcanic eruptions, can cloud the short-term picture, as has the focus on the non-existent "pause". 

What would happen if ECS is a bit lower that the "best-fit" value of 3°C of warming for doubling of greenhouse gas levels?  Mann explains:
I recently calculated hypothetical future temperatures by plugging different ECS values into a so-called energy balance model, which scientists use to investigate possible climate scenarios. The computer model determines how the average surface temperature responds to changing natural factors, such as volcanoes and the sun, and human factors—greenhouse gases, aerosol pollutants, and so on. (Although climate models have critics, they reflect our best ability to describe how the climate system works, based on physics, chemistry and biology. And they have a proved track record: for example, the actual warming in recent years was accurately predicted by the models decades ago.)
I then instructed the model to project forward under the assumption of business-as-usual greenhouse gas emissions. I ran the model again and again, for ECS values ranging from the IPCC's lower bound (1.5°C) to its upper bound (4.5°C). The curves for an ECS of 2.5 degrees and 3°C fit the instrument readings most closely. The curves for a substantially lower ECS did not fit the recent instrumental record at all, reinforcing the notion that they are not realistic.
To my wonder, I found that for an ECS of 3°C, our planet would cross the dangerous warming threshold of 2°C in 2036, only 22 years from now. When I considered the lower ECS value of 2.5°C, the world would cross the threshold in 2046, just 10 years later.
This is charted as: 

MIchael E. Mann's graph of future temperature for different climate sensitivities.  Click to enlarge.
Mann concludes that "even if we accept a lower ECS value, it hardly signals the end of global warming or even a pause. Instead it simply buys us a little bit of time—potentially valuable time—to prevent our planet from crossing the threshold."

As I have explained repeatedly, including in Dangerous climate warming: Myth and reality, 2°C is far from a safe level of warming. In fact, a strong case is made that climate change is already dangerous at less than 1°C of warming and, in James Hansen's analysis, “goals of limiting human made warming to 2°C and CO2 to 450 ppm are prescriptions for disaster” because significant tipping points – where significant elements of the climate system move from one discrete state to another – will be crossed. 

Aerosol's Faustian bargain

Mann also indicated what level of CO2 would be consistent with 2°C of warming:
These findings have implications for what we all must do to prevent disaster. An ECS of 3°C means that if we are to limit global warming to below 2°C forever, we need to keep CO2 concentrations far below twice pre-industrial levels, closer to 450 ppm. Ironically, if the world burns significantly less coal, that would lessen CO2 emissions but also reduce aerosols in the atmosphere that block the sun (such as sulfate particulates), so we would have to limit CO2 to below roughly 405 ppm.
The aerosol question is central but often not well understood. Human activities also influence the greenhouse effect by releasing non-gaseous substances such as aerosols (small particles) into the atmosphere. Aerosols include black-carbon soot, organic carbon, sulphates, nitrates, as well as dust from smoke, manufacturing, windstorms, and other sources.

Aerosols have a net cooling effect because they reduce the amount of sunlight that reaches the ground, and they increase cloud cover. This effect is popularly referred to as ‘global dimming’, because the overall aerosol impact is to reduce, or dim, the sun’s radiation, thus masking some of the effect of the increased greenhouse gas levels. This is of little comfort, however, because aerosols last only about ten days before being washed out of the atmosphere by rain; so we have to keep putting more and more into the air to maintain the temporary cooling effect.

Unfortunately, the principal source of aerosols is the burning of fossil fuels, which causes a rise in CO2 levels and global warming that lasts for many centuries. The dilemma is that if you cut the aerosols, the globe will experience a pulse of warming as their dimming effect is lost; but if you keep pouring aerosols together with CO2 into the air, you cook the planet even more in the long run. A Faustian bargain.

There has been an effort to reduce emissions from some aerosols because they cause acid rain and other forms of pollution. However, in the short term, this is warming the air as well as making it cleaner. As Mann notes above, likely reductions in coal burning in coming decades will reduce aerosol levels and boost warming

Some recent research suggest aerosol cooling is in the range of 0.5–1.2°C over the long run:
  • Leon Rotstayn in The Conversation explains that "results from CSIRO climate modelling suggest that the extra warming effect from a decline in aerosols could be about 1°C by the end of the century".
  • Present-day aerosol cooling effect will be strongly reduced by 2030 as more stringent air pollution controls are implemented in Europe and worldwide, and as advanced environmental technologies come on stream. These actions are projected to increase the global temperature by 1°C and temperatures over Europe by up to 2–4°C, depending on the severity of the action. This is one of the main research outcomes of the European Integrated project on Aerosol Cloud Climate and Air Quality Interaction project.
  • In 2011, NASA climate science chief James Hansen and co-authors warnedthat the cooling impact of aerosols appears to have been underestimated in many climate models and inferred that: "Aerosol climate forcing today is inferred to be −1.6±0.3Wm−2," which is equivalent to a cooling of about 1.2°C. In that case, they wrote, "humanity has made itself a Faustian bargain more dangerous than commonly supposed".
Conclusion

Michael E. Mann's analysis is sobering, especially when aerosols are accounted for. 

The world is already hitting 400 ppm CO2 (the daily average at the measuring station at Mauna Loa first exceeded 400 ppm on 10 May 2013 and currently rising at a rate of approximately 2 ppm/year and accelerating), so the message is very clear that today we have circumstances that can drive us to 2°C of warming, and that emissions from now on are adding to warming above 2°C and towards 3°C or more.  This reinforces my conclusion last year that there is no carbon budget left for 2°C of warming, and claims to the contrary are a dangerous illusion.

Mann concludes in not dis-similar terms: 
The conclusion that limiting CO2 below 450 ppm will prevent warming beyond 2°C is based on a conservative definition of climate sensitivity that considers only the so-called fast feedbacks in the climate system, such as changes in clouds, water vapor and melting sea ice. Some climate scientists, including James E. Hansen… say we must also consider slower feedbacks such as changes in the continental ice sheets. When these are taken into account, Hansen and others maintain, we need to get back down to the lower level of CO2 that existed during the mid-20th century — about 350 ppm. That would require widespread deployment of expensive “air capture” technology that actively removes CO2 from the atmosphere.
Furthermore, the notion that 2°C of warming is a “safe” limit is subjective. It is based on when most of the globe will be exposed to potentially irreversible climate changes. Yet destructive change has already arrived in some regions. In the Arctic, loss of sea ice and thawing permafrost are wreaking havoc on indigenous peoples and ecosystems. In low-lying island nations, land and freshwater are disappearing because of rising sea levels and erosion. For these regions, current warming, and the further warming (at least 0.5°C) guaranteed by CO2 already emitted, constitutes damaging climate change today

Labels: , ,

Monday, February 16, 2015

How to Stay Warm


Last night I had a wonderful dream
...hope that it will come true
   -  the Majors
That was just a dream
   - REM ( Losing my religion)

Greetings
        Here's a fun article on the history of heating.  Lots of great pictures, of " old fashioned" furniture, and " foreign looking" devices.   Living in the age of exuberance, we are generally familiar with heating air rather than heating people.  But as we move into The Age of Limits, I suspect it's something we'll be thinking about more. 

         Here's an excellent interview with David Fridley, Post Carbon fellow, and Berkley Lab scientist, on that very Age of Limits.     He paints an interesting picture of our post carbon future.   It's not exactly a " green dream"., although it may be largely powered by wind and solar.   He pops some of the usual bubbles.  Why an energy saving device ( like a Prius) probably doesn't save as much as we hope. ( if it saves money - that money goes somewhere - causing more energy wasting mischief) .    How unlikely we'll all be driving electric cars ( the problem of scale - how much lithium is there, anyway? ).   The extent to which, wind and solar are dependent on coal - and the difficulty of creating a " self replicating" fossil free energy source.   The problems of running a high energy civilization on low EROI devices.  Here's a doozy. - many stripper wells have negative EROI!  ( the pump that runs on electricity (from coal) uses more energy that the oil  that is produced. -   but it still makes sense financially, because coal is cheap) 
http://energyskeptic.com/2014/fridley-alternative-energy-wont-save-us/

So, get used to wearing sweaters, and drinking hot tea

Labels: , , ,

Friday, February 13, 2015


The revolution 
will not be televised
    -Gil Scott Heron
 Everybody wants to go to heaven
but no one wants to die
   -Anon  
Greetings

     Everybody is watching the price of oil.  Is  it rising?   Or will it go to $20?     And what should we wish for?    High prices and "energy Independence"  or low prices, and the more "driving around and buying stuff"
     Its all very confusing.  Well we do know, that some extent price and production are related, at least over the longer term.   Here,are some nice charts showing how its played out so far. 
  Here's one teaser:
"The Bank of Canada report reads: “Based on recent estimates of production costs, roughly one-third of current production could be uneconomical if prices stay around US$60, notably high-cost production in the United States, Canada, Brazil and Mexico (Chart 4). More than two-thirds of the expected increase in the world oil supply would similarly be uneconomical. 
    It's widely assumed that as long as the price stays high enough, the "oil will flow".   And the last few years seems to provide some evidence of that thesis.  Ron Patterson and the Peak Oil Barrel, (Why We Are at Peak Oil Now) argues to the contrary.  He asserts that regardless of price, we have hit the peak of production.   While he admits that higher prices will stimulate activity to deliver "unconventional" oil, that the decline rate for the conventional fields will swamp any additional production.
           The "shale revolution" is already getting long in the tooth.    David Hughes  suggest that production will peak  by 2016.

       And even the Financial Times  (US shale oil boom masks declining global supply ), agrees, that with out this production,  peak oil is here.
"Based on the preliminary 2014 supply data provided by the US Energy Information Administration in its most recent Short Term Energy Outlook, the total world crude oil supply increased by 3.5m b/d over 2005-14, rising to 77.3m b/d from 73.8m b/d. However, if we strip out the impact of rising production from US shale oil, the global crude oil supply actually declined by around 1m b/d over this period, to 72.6m b/d from 73.5m b/d."  
         Meanwhile , financial mavens watch the market nervously.   Oil companies are now reporting they "value" of their assets,  As this article  ( Shale Sub Prime and the Ides of March) points out, there are some nervous investors.
"In the so called "junk" bond market alone, rest presently 200 G$ (thousand million dollars) issued by petroleum companies. To this add debt instruments issued in other market segments, bonds issued by industries dependent on petroleum extraction (metallurgy, heavy machinery, sand extraction, logistics), plus leveraged products. In 2008, the "bail out" employed by the US government to save the financial sector from the housing "sub-prime" was 700 G$. The default deluge triggered by the "shale sub-prime" may not seem as large at this moment, but is certainly in the same order of magnitude." 
       
           So, what about the "oil shale revolution?   In this interview  with Chris Martenson  Art Berman: explains Why Today’s Shale Era Is The Retirement Party For Oil Production.     Quick synopsis: LTO needs to be about $90 bbl to break even. Cheap credit fueled Shale boom. Shale Oil sweet spots identified decades ago. Shale Oil reserves only provides two years of US consumption. There are only about handful of Shale plays that are economical worldwide. Oil prices need to rise back up to about $120 bbl for oil majors to increase CapEx. Dip in Oil prices won’t last.
-------
        It might be interesting to look at thge situation from the perspective of the Hirsch Report.  In that document, Robert Hirsch, suggested that if we had 20 years, we could create  a"ramp down" to make the transition to the post peak world less traumatic/  One might say that the "shale revolution" gave us  about 10 years.    How have we spent those years.  Have we beefed up the rail system?   Light rail?   How about electric cars?   Bicycles?  How about shoe leather?

Labels: , , , ,