Friday, February 13, 2015


The revolution 
will not be televised
    -Gil Scott Heron
 Everybody wants to go to heaven
but no one wants to die
   -Anon  
Greetings

     Everybody is watching the price of oil.  Is  it rising?   Or will it go to $20?     And what should we wish for?    High prices and "energy Independence"  or low prices, and the more "driving around and buying stuff"
     Its all very confusing.  Well we do know, that some extent price and production are related, at least over the longer term.   Here,are some nice charts showing how its played out so far. 
  Here's one teaser:
"The Bank of Canada report reads: “Based on recent estimates of production costs, roughly one-third of current production could be uneconomical if prices stay around US$60, notably high-cost production in the United States, Canada, Brazil and Mexico (Chart 4). More than two-thirds of the expected increase in the world oil supply would similarly be uneconomical. 
    It's widely assumed that as long as the price stays high enough, the "oil will flow".   And the last few years seems to provide some evidence of that thesis.  Ron Patterson and the Peak Oil Barrel, (Why We Are at Peak Oil Now) argues to the contrary.  He asserts that regardless of price, we have hit the peak of production.   While he admits that higher prices will stimulate activity to deliver "unconventional" oil, that the decline rate for the conventional fields will swamp any additional production.
           The "shale revolution" is already getting long in the tooth.    David Hughes  suggest that production will peak  by 2016.
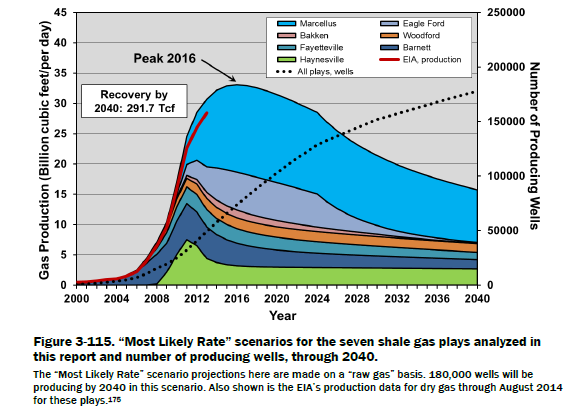
       And even the Financial Times  (US shale oil boom masks declining global supply ), agrees, that with out this production,  peak oil is here.
"Based on the preliminary 2014 supply data provided by the US Energy Information Administration in its most recent Short Term Energy Outlook, the total world crude oil supply increased by 3.5m b/d over 2005-14, rising to 77.3m b/d from 73.8m b/d. However, if we strip out the impact of rising production from US shale oil, the global crude oil supply actually declined by around 1m b/d over this period, to 72.6m b/d from 73.5m b/d."  
         Meanwhile , financial mavens watch the market nervously.   Oil companies are now reporting they "value" of their assets,  As this article  ( Shale Sub Prime and the Ides of March) points out, there are some nervous investors.
"In the so called "junk" bond market alone, rest presently 200 G$ (thousand million dollars) issued by petroleum companies. To this add debt instruments issued in other market segments, bonds issued by industries dependent on petroleum extraction (metallurgy, heavy machinery, sand extraction, logistics), plus leveraged products. In 2008, the "bail out" employed by the US government to save the financial sector from the housing "sub-prime" was 700 G$. The default deluge triggered by the "shale sub-prime" may not seem as large at this moment, but is certainly in the same order of magnitude." 
       
           So, what about the "oil shale revolution?   In this interview  with Chris Martenson  Art Berman: explains Why Today’s Shale Era Is The Retirement Party For Oil Production.     Quick synopsis: LTO needs to be about $90 bbl to break even. Cheap credit fueled Shale boom. Shale Oil sweet spots identified decades ago. Shale Oil reserves only provides two years of US consumption. There are only about handful of Shale plays that are economical worldwide. Oil prices need to rise back up to about $120 bbl for oil majors to increase CapEx. Dip in Oil prices won’t last.
-------
        It might be interesting to look at thge situation from the perspective of the Hirsch Report.  In that document, Robert Hirsch, suggested that if we had 20 years, we could create  a"ramp down" to make the transition to the post peak world less traumatic/  One might say that the "shale revolution" gave us  about 10 years.    How have we spent those years.  Have we beefed up the rail system?   Light rail?   How about electric cars?   Bicycles?  How about shoe leather?

Labels: , , , ,

Tuesday, August 19, 2014

Burning Rubber


You gassed her up, behind the wheel
Your arm around your sweetie
In your Oldsmobile 


- Tom Waits ( Heart of Saturday night)

I'm riding with lady luck
Freeway cars and trucks
      - Eagles


Greetings

       For years the American experience has been entwined with cars.  Americans are always talking about freedom.  What does that mean?   Getting in your car, burning rubber, and getting on the road!  

      So, it's a little sad to see that after all these years of more, we've hit " peak miles" .  As is nicely analyzed below, its a result of falling wages, higher gas prices, and stagnant MPG.   

       How about the EV?   Can EV's turn  that around?   Bring back the good old days?    There's a lot of talk about new battery technology, coming down the pike.  Due to arrive in 2016 or 2017.   Interesting timing.  2016 may also mark the year that oil production begins in descent from the plateau.  Even the optimistic EIA seems agree with that.  So, one scenario is a rise in gas prices giving the EV sales a boost, moving us into the new era.

       One has to wonder, though, whether the car buying public will be able to afford these new EVs.   The average Joe/Jane has seen his/her income drop by about 7% since it peaked in 2002.     Those who can afford to buy, still prefer trucks and SUVs over cars.

        Of course the key question is decline rates.  If the decline rate is slow, the EV technology with have a chance to "mature" and bring down costs.  A more severe decline rate, may cause  economic disruptions, reducing sales.   Here is an interesting analysis of the "giant" oil fields.  These 507 fields.  provide 60% of the total world production.  Approximately 80% are past peak, and have an average decline rate of 6.5%.  The addition of various technical solutions, such as additional drilling, can put off peak, but result in a steeper decline.  Fields that peaked in the last decade have a decline rate of 10%.

      The Hirsch report makes it clear that it is very difficult to handle the transition off oil, if you wait and start after the decline starts.    Here is one scenario that puts that in stark terms.    First she  figures out the rock bottom amount needed to run essential service - agriculture, rail, trucking, ambulance, police etc.  She puts that around 20% of our total use.   Then makes an  estimate of the decline rate.  She assumes it will start out slow and pick up to around 10%.  Then see how long it takes to get us into trouble.   Hmm.....

    "With a 4/5/6/7/8/9/10/10 /10/….. decline rate scenario, we’ll dip below the essential transportation fuel needed 16 years from now."


---------


This graph, from “economonitor,” is very interesting because it contains so much relevant information. (However, note one detail: the title of the graph, “Miles Driven” is somewhat misleading; it should be “mileage”, as the text of the post clearly says.) The relation of mileage to hourly wages is a parameter worth examining because it tells us a lot about the “systemic” efficiency of road transportation. What kind of efficiency can we actually afford?
Now, the graph shows a clear “peak mileage” which occurred around the year 2000, when Americas could afford the highest mileage from their cars in history. It was an efficiency peak of the road transportation system. But then, this efficiency diminished. How can we explain that?
The data of the graph depend on three factors 1) the cost of gasoline, 2) the average hourly wage, and 3) the average mileage of cars. Let see first the behavior of oil prices, which determine gasoline prices.
You see how oil prices spiked twice during the past 50 years, with the first and the second (ongoing) oil shocks. Amazingly, after the start of the first oil crisis, the mileage per hour worked increased, despite the steep price increases. But the opposite took place with the second oil crisis, mileage per hour worked rapidly decreased. Something must have compensated the price increase during the first crisis, but that is not occurring during the second. Why?
Of the other two parameters involved in the mileage curve, hourly wages play only a minor role. In real terms, wages have remained more or less constant in the US since the early 1970s, as you can see in this graph (source: income inequality)
What changed a lot in this period is the technology of cars. The first oil shock in the 1970s was, indeed, a shock. People reacted by actively seeking for technological solutions which would increase the mileage of their cars. And these solutions were easy to find: simply reducing the size and the weight of the monster gas guzzlers of the 1960s did the job. Look at these data (source):
You see how quickly mileage increased throughout the 1970s – it nearly doubled in less than 10 years! And you can see how quickly people forgot about the oil problem once prices collapsed in the second half of the 1980s. The graph also shows that, with the second oil crisis, mileage restarted to increase, but by far not as fast as in the 1970s. There is a reason: it is difficult to optimize something already optimized. This we call ‘diminishing returns of technological progress.”
In the end, it looks like the “peak mileage” of the late 1990s is the real one. In the future, the a combination of factors which led to the peak will never return. Oil depletion is destined to make oil less and less affordable, even though market oscillations may hide this phenomenon. Wages are unlikely to grow in real terms after having been static for the past 40 years. And technological miracles are unlikely. Even the Toyota Prius, technological marvel of our times, can only bring us back to where we were 15 years ago in terms of mileage per hour worked. As long as we remain within the paradigm of “road vehicle powered by a combustion engine” we have reached the limit of what we can do.
The result of the reduced overall efficiency of transportation we can see in this last graph (fromadvisorperspectives). In the US; people are driving less. Perhaps there are behavioral factors involved, but “peak mileage” suggest that they are doing that because they can’t afford to drive more.
h/t Giorgio Mastrorocco

Labels: , , , ,