Monday, July 28, 2014

Easy Money


A couple Jills with their eyes on a couple bills
Their eyes was statin'
They was waitin'
To get their hands on some easy money
    - Rickie Lee Jones


Greetings

   Anyone interested in the oil situation will want to take a look at Gail Tvbergs latest post.  (below)  She takes a tremendously complex situation and teases out good perspectives on many of the factors involved.   Oil production is affected by many factors besides geology , such a the stability of the country, access to markets, the ability of refiners to handle the product, cost of production, the cost of capital, and the price users can afford, among other factors.  She offers a glimpse into many of these.

      I was particularly interested in her analysis of the impact of the cost of money on US producers.  As we all know the federal reserve has lowered interest rates to historic lows.  This low cost money has help to finance the current drilling boom  No one knows when t interest rates will return to their normal levels, but they may start rising as early as October of this year.   If Gail is right, we could start to see a drop off in drilling as the cost of money rises.  Without an aggressive drilling program, these new wells go into a steep decline rapidly.  Of course, without the US boom, the world would already be at peak production.

   Also   Ron Peterson runs a nice blog on peak oil- probably the best site since the demise of the oil drum. Here is a nice article concerning our current situation.  He focuses mainly on shale, and Russia


Bonus Feature:  Professor  James Hamilton's latest paper.  "The Changing Face of World Oil Markets"
  Summary here.  paper here

-------


World Oil Production at 3/31/2014-Where are We Headed?

by Gail Tverberg, originally published by OurFiniteWorld.com  | TODAY
The standard way to make forecasts of almost anything is to look at recent trends and assume that this trend will continue, at least for the next several years. With world oil production, the trend in oil production looks fairly benign, with the trend slightly upward (Figure 1).
Figure 1. Quarterly crude and condensate oil production, based on EIA data.
If we look at the situation more closely, however, we see that we are dealing with an unstable situation. The top ten crude oil producing countries have a variety of problems (Figure 2). Middle Eastern producers are particularly at risk of instability, thanks to the advances of ISIS and the large number of refugees moving from one country to another.
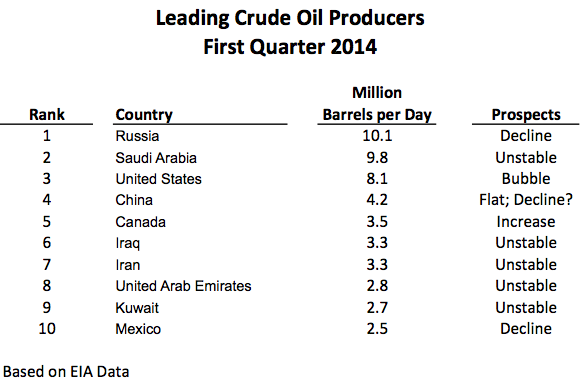
Figure 2. Top ten crude oil and condensate producers during first quarter of 2014, based on EIA data.
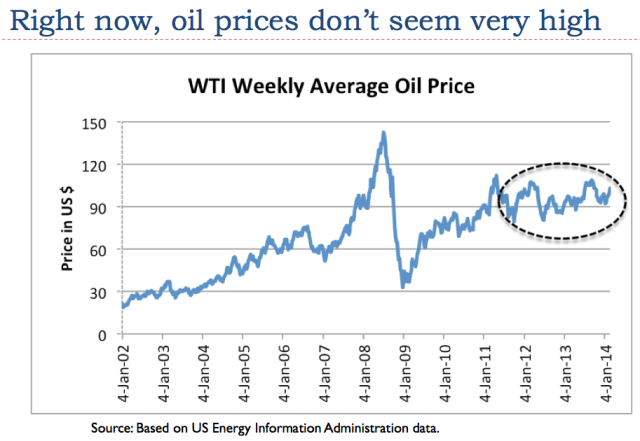
Relatively low oil prices are part of the problem as well. The cost of producing oil is rising much more rapidly than its selling price, as discussed in my post Beginning of the End? Oil Companies Cut Back on Spending. In fact, the selling price of oil hasn’t really risen since 2011 (Figure 3), because citizens can’t afford higher oil prices with their stagnating wages.
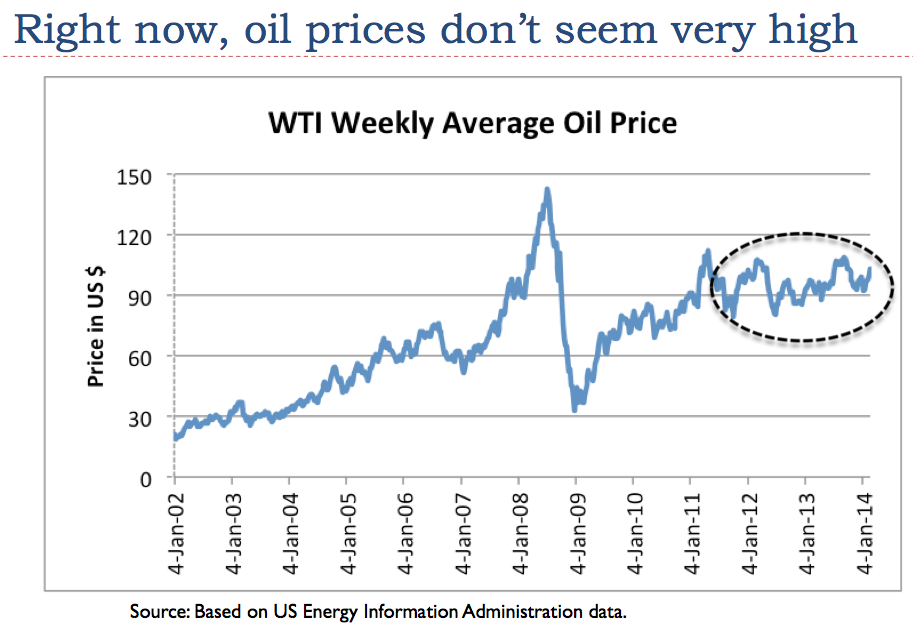
Figure 3. Average weekly oil prices, based on EIA data.
The fact that the selling price of oil remains flat tends to lead to political instability in oil exporters because they cannot collect the taxes required to provide programs needed to pacify their people (food and fuel subsidies, water provided by desalination, jobs programs, etc.) without very high oil prices. Low oil prices also make the plight of oil exporters with declining oil production worse, including Russia, Mexico, and Venezuela.
Many people when looking at future oil supply concern themselves with the amount of reserves (or resources) remaining, or perhaps Energy Return on Energy Invested (EROEI). None of these is really the right limit, however. The limiting factor is how long our current networked economic system can hold together. There are lots of oil reserves left, and the EROEI of Middle Eastern oil is generally quite high (that is, favorable). But instability could still bring the system down. So could popping of the US oil supply bubble through higher interest rates or more stringent lending rules.
The Top Two Crude Oil Producers: Russia and Saudi Arabia
When we look at quarterly crude oil production (including condensate, using EIA data), we see that Russia’s crude oil production tends to be a lot smoother than Saudi Arabia’s (Figure 4). We also see that since the third quarter of 2006, Russia’s crude oil production tends to be higher than Saudi Arabia’s.
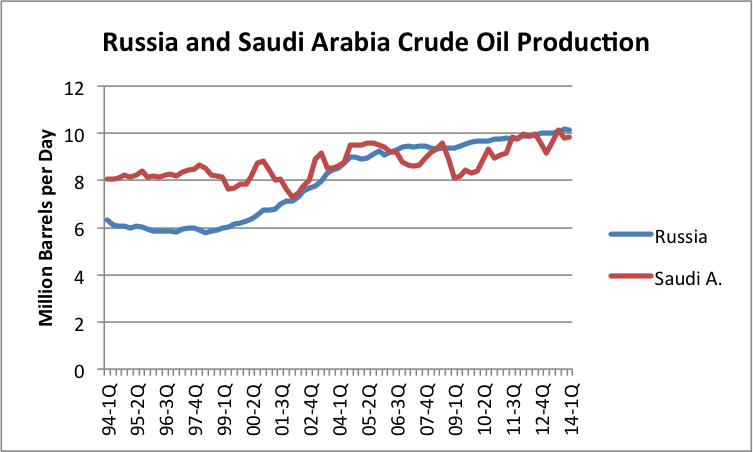
Figure 4.  Comparison of quarterly oil production for Russia and Saudi Arabia, based on EIA data.
Figure 4. Comparison of quarterly oil production (crude + condensate) for Russia and Saudi Arabia, based on EIA data.
Both Russia and Saudi Arabia are headed toward problems now. Russia’s Finance Minister has recently announced that its oil production has hit and peak, and is expected to fall, causing financial difficulties. In fact, if we look at monthly EIA data, we see that November 2013 is the highest month of production, and that every month of production since that date has dropped from this level. So far, the drop in oil production has been relatively small, but when an oil exporter is depending on tax revenue from oil to fund government programs, even a small drop in production (without a higher oil price) is a financial problem.
We see in Figure 4 above that Saudi Arabia’s quarterly oil production is quite erratic, compared to oil production of Russia. Part of the reason Saudi Arabia’s oil production is so erratic is that it extends the life of its fields by periodically relaxing (reducing) production from them. It also reacts to oil price changes–if the oil price is too low, as in the latter part of 2008 and in 2009, Saudi oil production drops. The tendency to jerk oil production around gives the illusion that Saudi Arabia has spare production capacity. It is doubtful at this point that it has much true spare capacity. It makes a good story, though, which news media are willing to repeat endlessly.
Saudi Arabia has not been able to raise oil exports for years (Figure 5). It gained a reputation for its oil exports back in the late 1970s and early 1980s, and has been able to rest on its laurels. Its high “proven reserves” (which have never been audited, and are doubted by many) add to the illusion that it can produce any amount it wants.
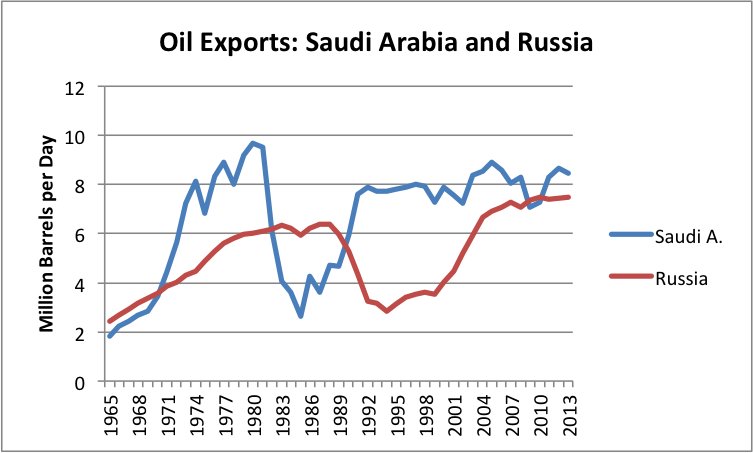
Figure 5. Comparison of Russian and Saudi Arabian oil exports, based on BP Statistical Review of World Energy 2014 data. Pre-1985 Russian amounts estimated based on Former Soviet Union amounts.
Figure 5. Comparison of Russian and Saudi Arabian oil exports, based on BP Statistical Review of World Energy 2014 data (oil production minus oil consumption). Pre-1985 Russian amounts estimated based on Former Soviet Union amounts.
In 2013, oil exports from Russia were equal to 88% of Saudi Arabian oil exports. The world is very close to being as dependent on Russian oil exports as it is on Saudi Arabian oil exports. Most people don’t realize this relationship.
The current instability of the Middle East has not hit Saudi Arabia yet, but there is increased fighting all around. Saudi Arabia is not immune to the problems of the other countries. According to BBC, there is already a hidden uprising taking place in eastern Saudi Arabia.
US Oil Production is a Bubble of Very Light Oil
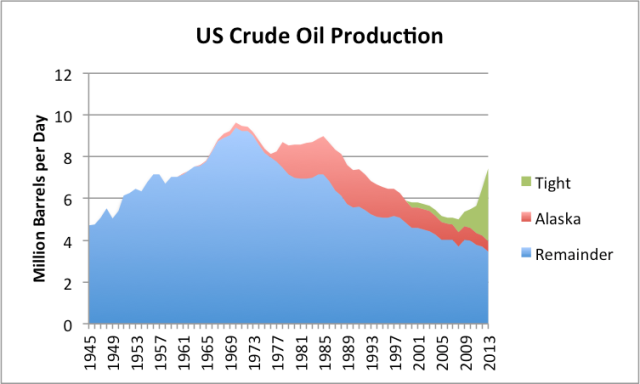
The US is the world’s third largest producer of crude and condensate. Recent US crude oil production shows a “spike” in tight oil productions–that is, production using hydraulic fracturing, generally in shale formations (Figure 6).
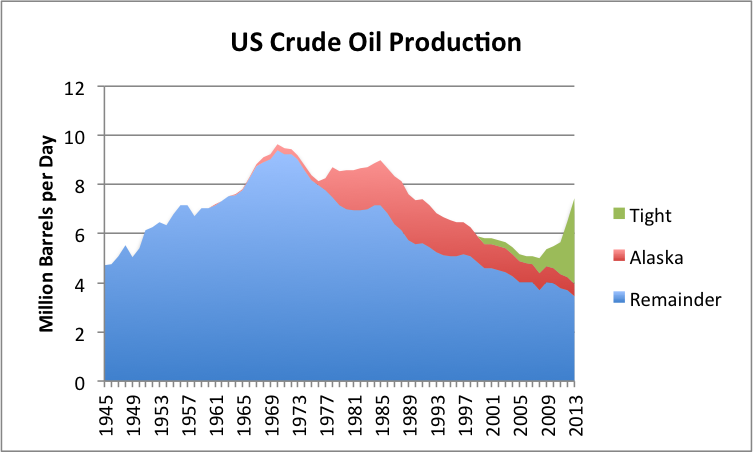
Figure 6. US crude oil production split between tight oil (from shale formations), Alaska, and all other, based on EIA data. Shale is from  AEO 2014 Early Release Overview.
Figure 6. US crude oil production split between tight oil (from shale formations), Alaska, and all other, based on EIA data. Shale is from AEO 2014 Early Release Overview.
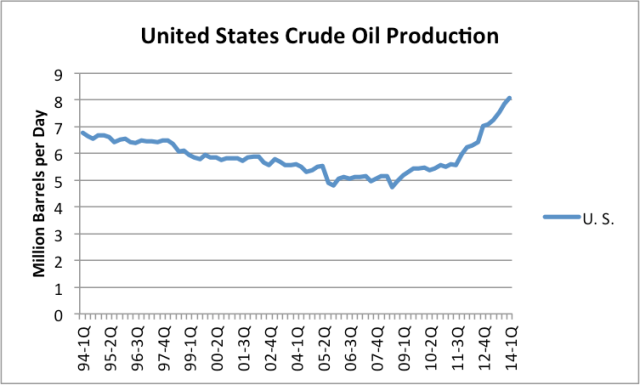
If we look at recent data on a quarterly basis, the trend in production also looks very favorable.
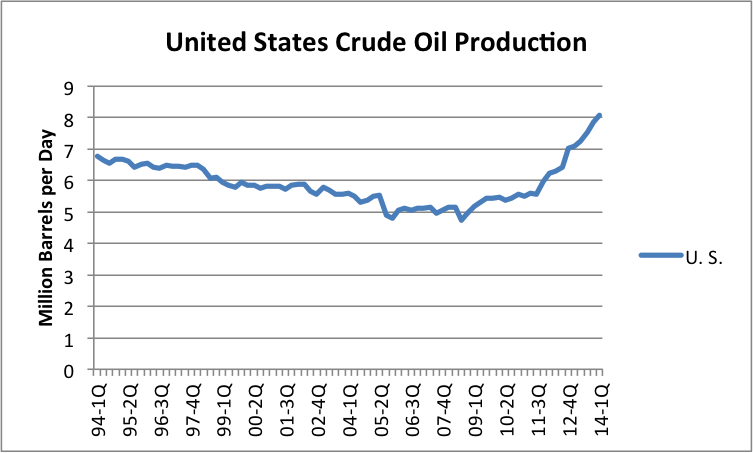
Figure 7. US Crude and condensate production by quarter, based on EIA data.
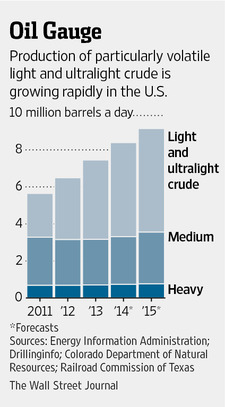
The new crude is much lighter than traditional crude. According to the Wall Street Journal, the expected split of US crude is as follows:
Figure 8. Wall Street Journal image illustrating the expected mix of US crude oil.
There are many issues with the new “oil” production:
  • The new oil production is so “light” that a portion of it is not what we use to power our cars and trucks. The very light “condensate” portion (similar to natural gas liquids) is especially a problem.
  • Oil refineries are not necessarily set up to handle crude with so much volatile materials mixed in. Such crude tends to explode, if not handled properly.
  • These very light fuels are not very flexible, the way heavier fuels are. With the use of “cracking” facilities, it is possible to make heavy oil into medium oil (for gasoline and diesel). But using very light oil products to make heavier ones is a very expensive operation, requiring “gas-to-liquid” plants.
  • Because of the rising production of very light products, the price of condensate has fallen in the last three years. If more tight oil production takes place, available prices for condensate are likely to drop even further. Because of this, it may make sense toexport the “condensate” portion of tight oil to other parts of the world where prices are likely to be higher. Otherwise, it will be hard to keep the combined sales price of tight oil (crude oil + condensate) high enough to encourage more tight oil production.
The other issue with “tight oil” production (that is, production from shale formations) is that its production seems to be a “bubble.” The big increase in oil production (Figure 6) came since 2009 when oil prices were high and interest rates were very low. Cash flow from these operations tends to be negative. If interest rates should rise, or if oil prices should fall, the system is likely to hit a limit. Another potential problem is oil companies hitting borrowing limits, so that they cannot add more wells.
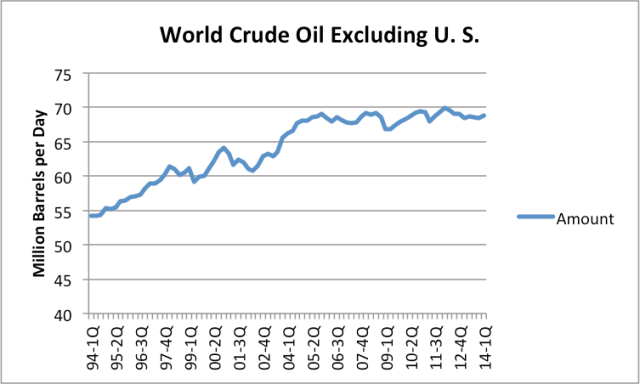
Without US oil production, world crude oil production would have been on a plateau since 2005.
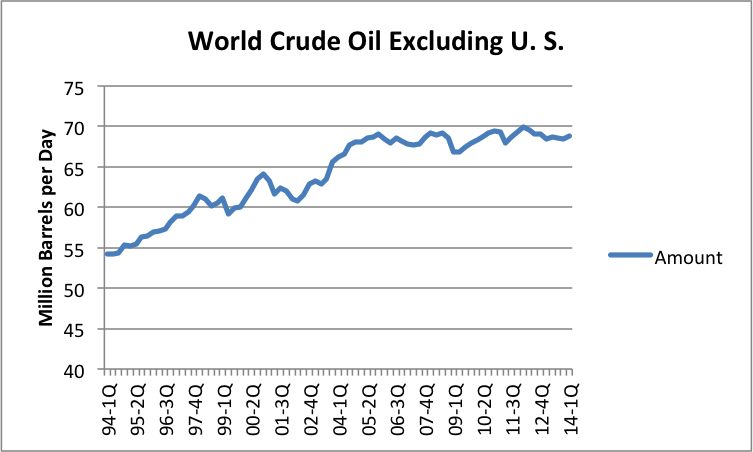
Figure 9. World crude and condensate, excluding US  production, based on EIA data.
Figure 9. World crude and condensate, excluding US production, based on EIA data.
Canadian Oil Production
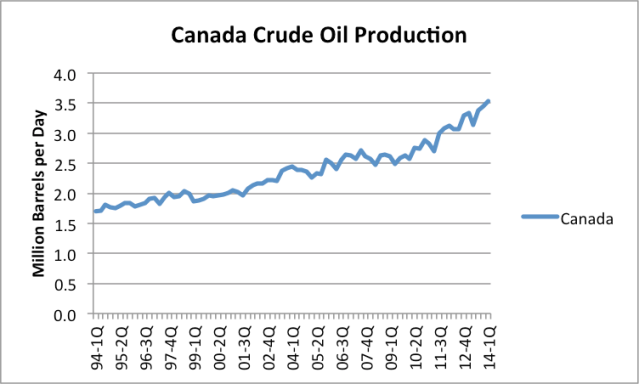
The other recent success story with respect to oil production is Canada, the world’s fifth largest producer of crude and condensate. Thanks to the oil sands, Canadian oil production has more than doubled since the beginning of 1994 (Figure 10).
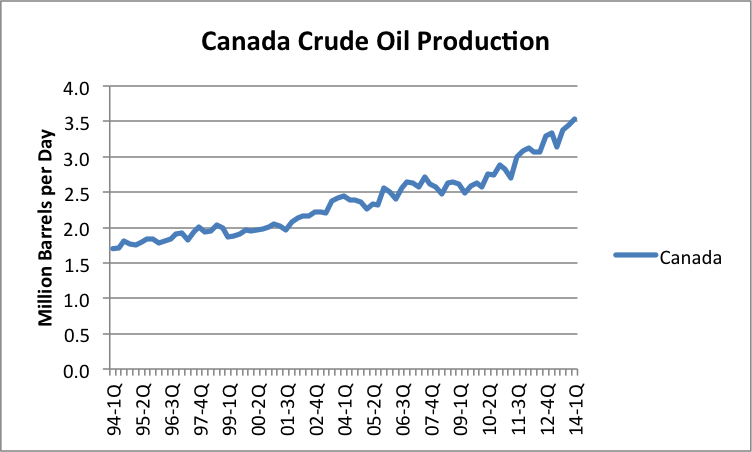
Figure 10. Canadian quarterly crude oil (and condensate) production based on EIA data.
Of course, there are environmental issues with respect to both oil from the oil sands and US tight oil. When we get to the “bottom of the barrel,” we end up with the less environmentally desirable types of oil. This is part of our current problem, and one reason why we are reaching limits.
Oil Production in China, Iraq, and Iran
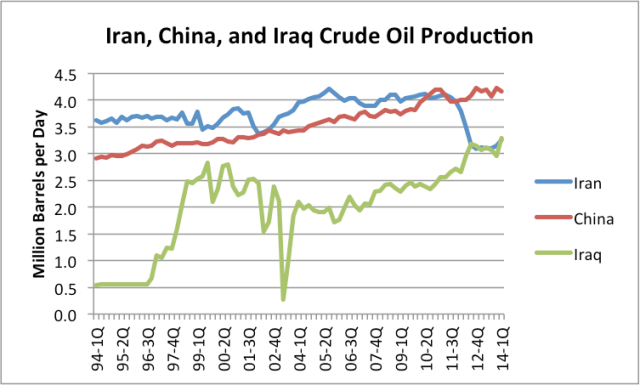
In the first quarter of 2014, China was the fourth largest producer of crude oil. Iraq was sixth, and Iran was seventh (based on Figure 2 above). Let’s first look at the oil production of China and Iran.
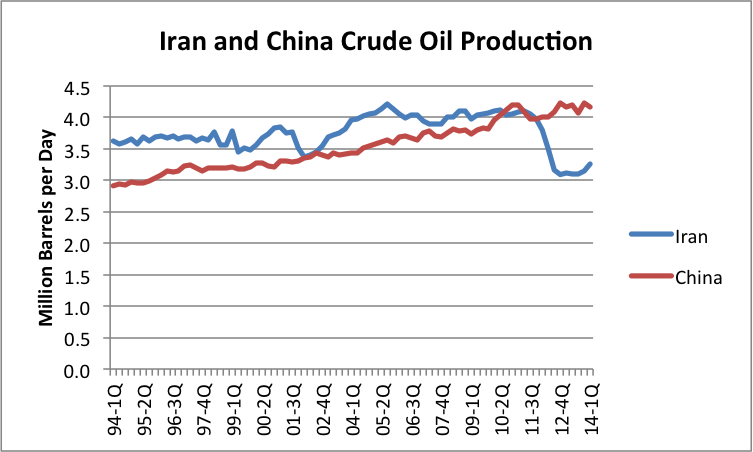
Figure 11. China and Iran crude and condensate production by quarter based on EIA data.
As of 2010, Iran was the fourth largest producer of crude oil in the world. Iran has had so many sanctions against it that it is hard to figure out a base period, prior to sanctions. If we compare Iran’s first quarter 2014 oil production to its most recent high production in the second quarter of 2010, oil production is now down about 870,000 barrels a day. If sanctions are removed and warfare does not become too much of a problem, oil production could theoretically rise by about this amount.
China has relatively more stable oil production than Iran. One concern now is that China’s oil production is no longer rising very much. Oil production for the fourth quarter of 2013 is approximately tied with oil production for the fourth quarter of 2012. The most recent quarter of oil production is down a bit. It is not clear whether China will be able to maintain its current level of production, which is the reason I mention the possibility of a decline in oil production in Figure 2.
The lack of growth in China’s oil supplies may be behind its recent belligerence in dealing with Viet Nam and Japan. It is not only exporters that become disturbed when oil supplies are not to their liking. Oil importers also become disturbed, because oil supplies are vital to the economy of all nations.
Now let’s add Iraq to the oil production chart for Iran and China.
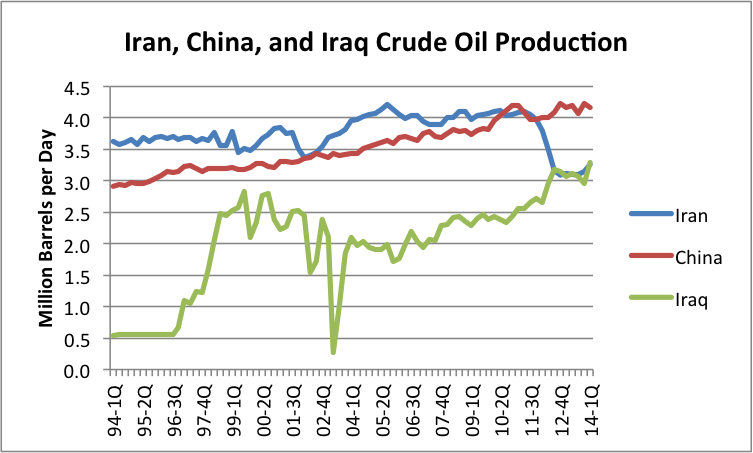
Figure 12. Quarterly crude oil and condensate production for Iran, China, and Iraq, based on EIA data.
Thanks to improvements in oil production in Iraq, and sanctions against Iran, oil production for Iraq slightly exceeds that of Iran in the first quarter of 2014. However, given Iraq’s past instability in oil production, and its current problems with ISIS and with Kurdistan, it is hard to expect that Iraq will be a reliable oil producer in the future. In theory Iraq’s oil production can rise a few million barrels a day over the next 10 or 20 years, but we can hardly count on it.
The Oil Price Problem that Adds to Instability
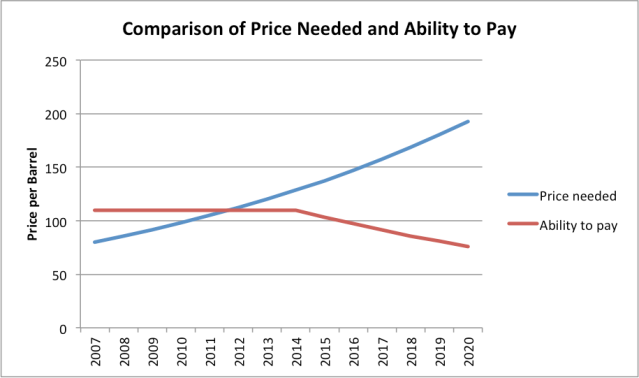
Figure 13 shows my view of the mismatch between (1) the price oil producers need to extract their oil and (2) the price consumers can afford. The cost of extraction (broadly defined including taxes required by governments) keeps rising while “ability to pay” has remained flat since 2007. The inability of consumers to pay high prices for oil (because wages are not rising very much) explains why oil prices have remained relatively flat in Figure 3 (near the top of this post), even while there is fighting in the Middle East.
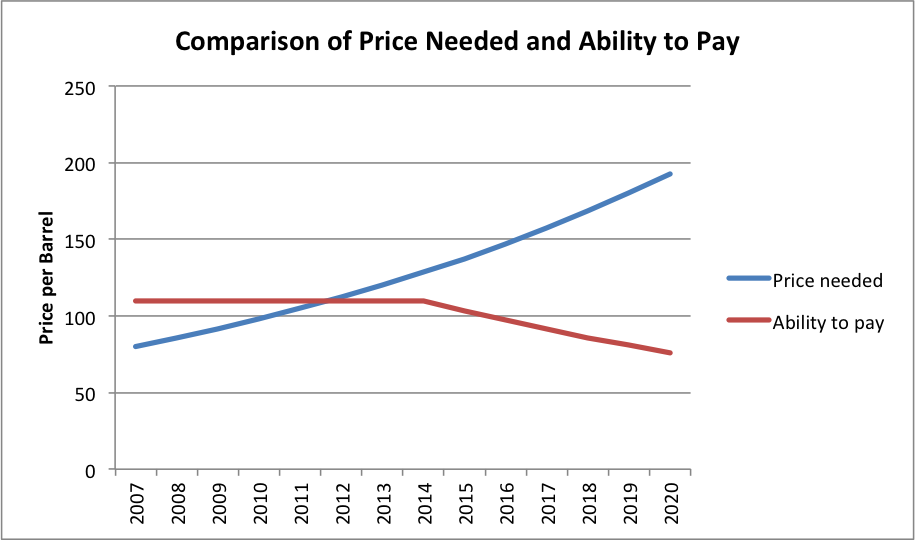
Figure 3. Comparison of oil price per barrel needed (Brent) with ability to pay. Amounts based on judgement of author.
Figure 13. Comparison of oil price per barrel needed by producers (Brent) with ability to pay. Amounts based on judgment of author.
When the selling price is lower than the full cost of production (including the cost of investing in new wells and paying dividends to shareholders), the tendency is to reduce production, one way or another. This reduction can be voluntarily, in the form of a publicly traded company buying back stock or selling off acreage.
Alternatively, the cutback can be involuntary, indirectly caused by political instability. This happens because oil production is typically heavily taxed in oil exporting nations. If the oil price remains too low, taxes collected tend to be too low, making it impossible to fund programs such as food and fuel subsidies, desalination plants, and jobs programs. Without adequate programs, there tend to be uprisings and civil disorder.
If a person looks closely at Figure 13, it is clear that in 2014, we are out in “Wile E. Coyote Territory.” The broadly defined cost of oil extraction (including required taxes by exporters) now exceeds the ability of consumers to pay for oil. As a result, oil prices barely spike at all, even when there are major Middle Eastern disruptions (Figure 3, above).
The reason why Wile E. Coyote situation can take place at all is because it takes a while for the mismatch between costs and prices to work its way through the system. Independent oil companies can decide to sell off acreage and buy back shares of stock but it takes a while for these actions to actually take place. Furthermore, the mismatch between needed oil prices and charged oil prices tends to get worse over time for oil exporters. This lays the groundwork for increasing dissent within these countries.
With oil prices remaining relatively flat, importers become complacent because they don’t understand what is happening. It looks like we have no problem when, in fact, there really is a fairly big problem, lurking behind the scenes.
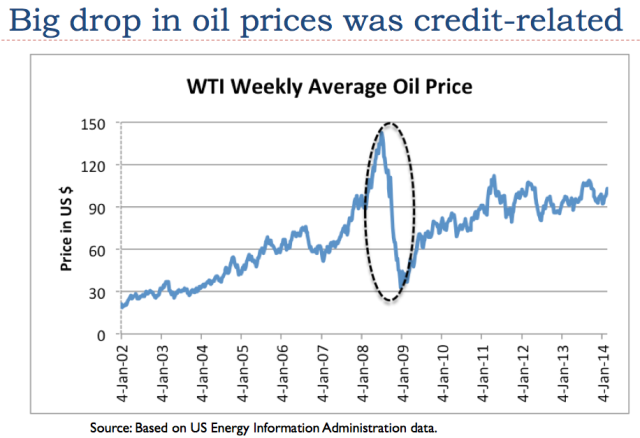
To make matters worse, it is becoming more and more difficult to continue Quantitative Easing, a program that tends to hold down longer-term interest rates. The expectation is that the program will be discontinued by October 2014. The reason why the price of oil has stayed as high as it has in the last several years is because of the effects of quantitative easing and ultra low interest rates. If it weren’t for these, oil prices would fall, because consumers would need to pay much more for goods bought on credit, leaving less for the purchase of oil products. See my recent post, The Connection Between Oil Prices, Debt Levels, and Interest Rates.
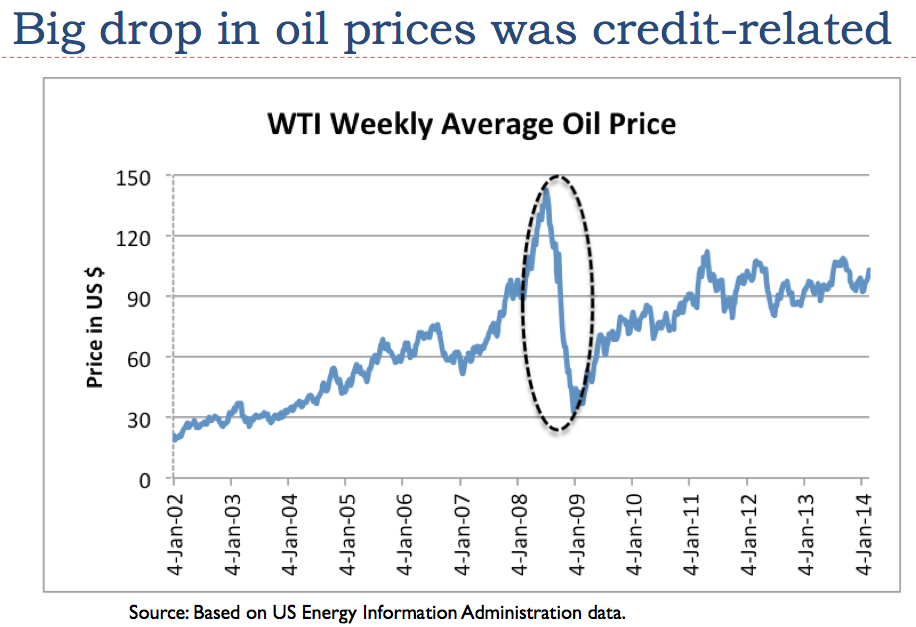
Figure 4. Big credit related drop in oil prices that occurred in late 2008 is now being mitigated by Quantitative Easing and very low interest rates.
Figure 14. Big credit related drop in oil prices that occurred in late 2008 is now being mitigated by Quantitative Easing and very low interest rates.
Because of the expectation that Quantitative Easing will end by October 2014 and the pressure to tighten credit conditions, my expectation is that the affordable price of oil will start dropping in late 2014, as shown in Figure 13. The growing disparity between what consumers can afford and what producers need tends to make the Wile E. Coyote overshoot condition even worse. It is likely to lead to more problems with instability in the Middle East, and a collapse of the US oil production bubble.
Conclusion
I explained earlier that we live in a networked economy, and this fact changes the way economic models work. Many people have developed models of future oil production assuming that the appropriate model is a “bell curve,” based on oil depletion rates and the inability to geologically extract more oil. Unfortunately, this isn’t the right model.
The situation is far more complex than simple geological decline models assume. There are multiple limits involved–prices needed by oil producers, prices affordable by oil importers, and prices for other products, such as water and food. Interest rates are also important. There are time lags involved between the time the Wile E. Coyote situation begins, and the actions to fix this mismatch takes place. It is this time lag that tends to make drop-offs very steep.
The fact that we are dealing with political instability means that multiple fuels are likely to be affected at once. Clearly natural gas exports from the Middle East will be affected at the same time as oil exports. Many other spillover effects are likely to happen as well. US businesses without oil will need to cut back on operations. This will lead to job layoffs and reduced electricity use. With lower electricity demand, prices for electricity as well as for coal and natural gas will tend to drop. Electricity companies will increasingly face bankruptcy, and fuel suppliers will reduce operations.
Thus, we cannot expect decline to follow a bell curve. The real model of future energy consumption crosses many disciplines at once, making the situation difficult to model. The Reserves / Current Production model gives a vastly too high indication of future production, for a variety of reasons–rising cost of extraction because of diminishing returns, need for high prices and taxes to support the operations of exporters, and failure to consider interest rates.
The Energy Return on Energy Invested model looks at a narrowly defined ratio–usable energy acquired at the “well-head,” compared to energy expended at the “well-head” disregarding many things–including taxes, labor costs, cost of borrowing money, and required dividends to stockholders to keep the system going. All of these other items also represent an allocation of available energy. A multiplier can theoretically adjust for all of these needs, but this multiplier tends to change over time, and it tends to differ from energy source to energy source.
The EROEI ratio is probably adequate for comparing two “like products”–say tight oil produced in North Dakota vs tight oil produced in Texas, or a ten year change in North Dakota energy ratios, but it doesn’t work well when comparing dissimilar types of energy. In particular, the model tends to be very misleading when comparing an energy source that requires subsidies to an energy source that puts off huge tax revenue to support local governments.
When there are multiple limits that are being encountered, it is the financial system that brings all of the limits together. Furthermore, it is governments that are at risk of failing, if enough surplus energy is not produced. It is very difficult to build models that cross academic areas, so we tend to find models that reflect “silo” thinking of one particular academic specialty. These models can offer some insight, but it is easy to assume that they have more predictive value than they do.
Unfortunately, the limits we are reaching seem to be financial and political in nature. If these are the real limits, we seem to be not far away from the simultaneous drop in the production of many energy products. This type of limit gives a much steeper drop off than the frequently quoted symmetric “bell curve of oil production.” The shape of the drop off corresponds to (1) the type of drop off experienced by previous civilizations when they collapsed, (2) the type of drop-off I have forecast for world energy consumption, and (3) Ugo Bardi’s Seneca cliff. The 1972 book Limits to Growth by Donella Meadows et al. says (page 125), “The behavior mode of of the system shown in figure 35 is clearly that of overshoot and collapse,” so it tends to come to the same conclusion as well.

Labels: , , , ,

Tuesday, July 15, 2014

Of decline rates, and export land and cabbages and kings

We'll meet under that giant Exxon sign
    - Bruce Springsteen (Jungle Land)

Baby you can drive my car
    -The Beatles


Greetings

       As we all know, in the oil production world, there are three biggies - US, Russia, and Saudi Arabia.   Then there is the rest.   These top three produce about 1/3 of the world total, so it makes sense to keep an eye on them.   

       From an "export land" perspective, it is important to look both at production, and oil consumption within these countries.     

       The US peaked in the 70's. , but as we hear constantly from the media has recently reversed its decline.  (For an nice take on the propaganda campaign see Orwellian Newspeak and the Oil Industry)   This development is admitted to be short lived, with the EIA predicting a decline by 2019,   (" Crude oil production (including lease condensate) increases from 13.9 quadrillion Btu in 2012 to a peak of 20.5 quadrillion Btu in 2019 ") and others as early as 2016.   Decline rates have historivally been low, however decline rates from fracked wells are quite large, so it is not clear what the future holds.   Although oil use in the US dropped dramatically in recent years, the numbers for 2013 show a new surge in use.  see here.  (Total oil consumption rose by 400,000 barrels, and even gasoline use rose - for the first time since 2007) .    

        Russia, has apparently peaked as well.  (!).  This development has,of course, not, been trumpeted by the media.   But the Russian government has confirmed that production is expected to fall  ("The ministry said Monday it expects a $4.5 billion decline in oil export revenue because of an anticipated 6.3 percent drop in oil production...".  see here  OPEC is also assuming a decline of Russian production.    For a good summary of the Russian production situation see  here..   Oil consumption in Russia has been on a plateau since the breakup of the USSR.

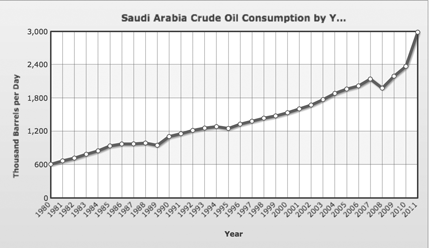
        No one really knows whats happening in Saudi.  They are on a production plateau.  Whether they can increase ir not, is unknown.  Normally they will increase when some other country goes off line.  But when Libya's production dropped, they did not step in.   One the consumption side, things have changed dramatically.   Despite efforts to diversify their energy use, oil use has shot up.  See chart.below.

        So, in summary: Russia production is rolling over, and likely to decline sharply.  The US  production is due to peak in the next few years, and consumption is apparently growing again.  Saudi production seems to be flat, with consumption growing rapidly.   The impact to net exports is pretty straightforward.   The three largest producers will either be exporting less, or (in the case of the US) - importing more.  

      There are some counties with "spare capacity" - Iraq, Libya and Nigeria come to mind.  But how likely are they to plug the hole? 
       
-------


SUNDAY, JULY 13, 2014

Tech Talk - Here we go again, again

A couple of posts or so ago I mentioned that there are three major problems sitting relatively un-noticed as we head into the mess of Peak Oil. Of these, perhaps the one that gets the least attention is the steady decline in production from existing wells. We are just about at the point where the Alaskan Pipeline will tip over into feeding less than half-a-million barrels a day down from the North Slope. (It sent 501 kbd down the pipe in June with a 98.6% reliability factor). At the same time those in control of the oilfields in the Russia are reporting that Russian exports have fallen to the lowest level in 6 years. This brings back the relatively unrecognized reality of the Export Land Modelwhich Jeffrey Brown first introduced on The Oil Drum back in 2007.

It is worth resurrecting that thinking (which time has proven to be only too true) as we look at the continued declines in production from the UK, as an example. It is not easily discernable from the official Department of Energy and Climate Change, which plots oil production on a monthly basis (with different months having a variety of days):


Figure 1. Monthly production of oil from the fields of the UK continental shelf (DECC ).

Euan Mearns has, however, done the necessary arithmetic and clearly shows the reality of the situation once one converts it back to barrels per day:


Figure 2. UK production of oil and natural gas over the past decade (Euan Mearns)

The steady decline has also been noted by the EIA who commented that UK production fell by 9% from 2012 to 2013. There was a time, back in the days of The Oil Drum, where we debated whether an estimate of 5% for field decline rates was or was not too high. Obviously those days are now behind us, and reality is starting to show numbers that far exceed the rates that, at the time, some thought rather pessimistic. To continue the UK numbers, as OPEC recently anticipated, the decline this year will take the total down to 800 kbdwith an 8% decline expected for this year.

The Export Land Model, in its simplest form, can be illustrated with the following plot:


Figure 3. A simplified illustration of the changing production, internal use and exports for an oil producing country, once it reaches a peak in production (Sam Foucher )

The argument that produces the above plot goes along the lines that, as an oil producer (think for a moment of Russia for eg) produces larger volumes of oil, so the economy of that country starts to grow. As that growth continues it demands an increasing amount of energy to sustain the increased internal demand (the green line). However, once production stabilizes or starts to decline (the blue line above) so the amount available for export becomes reduced (the red line).

The three top producers of petroleum products in the world are the United States, Russia and the Kingdom of Saudi Arabia. The United States consumes far more than it produces, and thus is already a net importer of petroleum products, although in the short term, as I noted earlier production gains from the Bakken and Eagle Ford are hiding the problems of decline rate. It is increasingly unlikely that any significant volume of US oil will make it onto the world market.

Saudi Arabia has, for years, controlled the amount of oil that it puts on the market, based on the anticipated global demand, and the supply available from the rest of the world - so that the global price remains at a level to sustain OPEC economies. That has been illustrated over the past couple of years by the increase in production from the KSA to cover the decline from Libya as about a million barrels a day disappeared from the global market. The gains in production from the US helped in meeting global demand and the strain in supply was thus relatively easily hidden. But the KSA has an imminent problem that has largely disappeared from public view now that the eyes of The Oil Drum correspondents have lost that focus.

The major oilfields of the Kingdom are old, and to sustain production perimeter wells were located around the oilfields that injected millions of barrels of seawater a day, to drive the oil towards the center of the fields, where it could be relatively easily recovered from Maximum Reservoir Contact wells drilled along the very top of the reservoirs. But as folk such as JoulesBurn have noted, those wells slowly change in nature, over time, as the oil migration continues, and water injection must move inwards to ensure continued production.


Figure 4. Layout of initial wells at the Haradh III development in the Ghawar oilfield in Saudi Arabia (JoulesBurn at The Oil Drum)

He noted, in the original post, that Aramco had to drill some 52 wells, rather than the estimated 32, to get the production they needed, and that was back in 2010. Since then Ghawar has continued to produce for the Kingdom, but with daily levels of up around 10 mbd, the volumes in the crests of the anticlines along which the oil wells sit within the Ghawar field have been steadily contracting, and although they have carried out some of the most advanced oilwell engineering to sustain production from the attic oil in the older parts of the fields, there are only so many ways you can squeeze a rock before you get out all the oil that you will – and those days are approaching fast.

At the same time (relating back to the ELM) while Saudi production has remained at just under 10 mbd for the past few years, internal demand has been rising at a steadily more rapid rate.


Figure 5. Internal consumption of oil in Saudi Arabia (Index Mundi ).

Hoping to transition some of the current internal demands to natural gas, the KSA has been looking for internal resources to allow it to move away from oil. However the search has not been as successful as hoped, particularly with the search for natural gas, Shell having backed out of the program as a result of the poor results to date.

With internal consumption continuing to rise at more than twice the rate anticipated by the ELM shown in Figure 3, and, at best, stable production, global exports from the Kingdom are of increasing concern.

Which brings us back to Russia, where the new fields that must be exploited to sustain production are in remote parts of Eastern Siberia and the Yamal Peninsula – if not offshore in the Arctic.

Russian oil production has been peaking for some time (falling from 3.4% growth in 2012 to 1.3% in 2013) and is now reported to likely fall by 6.3% over the next two years. Since this implies that Russia is now at peak, the decline in overall production initially will fall below that of Figure 3, though likely only for a year or so, before the rate will be, at minimum, that shown. (The reason for this conclusion comes from the lack of enough investment in the fields where growth can be expected). At the same time internal demand is rising at around 100 kbd or 3% pa slightly above the value assumed for Figure 3.

If none of the three largest producers can even sustain exports, and the ELM explains why they can’t, and world demand continues to rise at the rates projected, then, in even the short-term, something is going to have to give. The logical weakest link is price, with the consequence, that invalidates a lot of the other arguments, of a significant impact on global economic health. As we have seen before, significant increases in price lowers the demand for oil, and thus demand from the various nations will become even more skewed.

The only problem, with this next iteration, is that there isn’t another Bakken or Eagle Ford conveniently sitting waiting to be tapped.

Labels: , , , ,

Tuesday, April 15, 2014


"At night we ride through mansions of glory
 in suicide machines"
   - Bruce Springsteen (Born to Run)


Greetings

      I suppose its only natural that thinking about resource limits and climate weirding would make me think about beer and wine.    

    Mostly about yeast 

      Any of you whole has the pleasure of making your own beer or wine know, that our friends the yeasts work hard to turn sugar into alcohol.  The multiply like crazy, until they hit "peak yeast", then they go to works converting the sugars, and a week or so later, presto.  

       In beer, the yeast hit a resource limit  (no more sugar), and quit.  Happily for them, they are still in a benign environment, so they survive, albeit in a "resting state".  With wine, the yeast create a situation in which even they cannot survive.  Alcohol levels get to be too high..  They created their own toxic environment. 

      We humans are using up the resources as fast as we can.   "Peak humans" is probably not that far away.   According to the "Reference run" on World 3 , peak humans occurs around 2030 at around 7 billion.  It is preceded by "peak food" when appears to peak around 2015. 

     One wonders whether we will leave behind a toxic environment.   .   

-------
     
    Here's an article on farmers in California, buying up well drilling equipment in the race for groundwater.  Well Drilling Boom

"Smittcamp said he worries that so much drilling could cause underground water supplies to run dry in little more than a decade. He blames politicians for failing to give farmers any other options, leaving them to fend for themselves.
This summer, Smittcamp said he has to come up with two-thirds of his water that would normally come from the state and federal water deliveries.
"This year, we get none out of the projects," he said. "So we've got to pump the whole enchilada."
-----

Speaking of food He's some interesting stats on food production in Russia and Ukraine.   

Ukraine currently stands as the 6th largest wheat exporter. Total production was about 16 million tons during 2012 putting it in the 11th largest producer spot worldwide. Over a four year period, from 2009 to 2012, production had remained about level, fluctuating between about 16 and 22 million metric tons. Although, it’s worth noting that drought years 2010 and 2012 were both 16 million ton years respectively.
Russia, on the other hand, has seen steadily declining grain production over the period. Wheat production in 2009 was 61 million metric tons while wheat production in 2012 had fallen to 38 million metric tons. From 2010 to 2012, Russia experienced a series of extreme heat and fire seasons that disrupted food production, ruining large swaths of farmlands.
Note that the 2010 Russian wheat disruption occurred during an el Nino.  World Meteorological Organization now predicts an El Nino for 2014

--------

World Food Security Slides into Red Zone as FAO Index Jumps to 213, Russian Special Forces Continue to Destabilize Breadbasket Ukraine, and Climate-Change Induced Extreme Weather Ravages Croplands

Feeling impacts from a broad range of stresses including widespread heat and drought from the US West, to South America, to Australia and Southeast Asia, the ongoing Russian invasion and destabilization of breadbasket Ukraine, and the growing threat of a strong El Nino emerging in the Pacific, world food prices made another significant jump during March of 2014.
According to the UN Food and Agriculture Organization (FAO), global food index prices surged from a value of 208 in February to 212.8 in March. The 4.8 point increase from February to March followed on the heels of a 5.5 point increase between January and February.
Values above 210 are considered to result in enough stress to ignite conflict as an increasing number of regions begin to see scarcity from lack of ability to purchase or produce food. For the time being, these prices remain below the 2011 high water mark of 229 which was linked to a broad eruption of conflict and food riots from Libya to Egypt to Syria and throughout a smattering of other impoverished or vulnerable regions in Asia and around the globe.
But with the world climate situation worsening, with chances for a strong El Nino emerging later this year increasing, and with global conflict over dwindling and endangered stores of food-related wealth and resources intensifying, there remains a substantial risk that global food prices will continue to see strong upward pressure throughout 2014, pushing and maintaining levels high enough to continue to ignite instability, unrest and, in some cases, open warfare.
(The first episode of Showtime’s “Years of Living Dangerously” provides a close look at two regions suffering directly from crop losses, economic impacts and hunger due to extreme droughts related to climate change — Syria and the US Southwest. It provides a view, in close-up of what happens due to years-long droughts and related food and resource shortages. In the US, loss of grazing land resulted in the closing of meat packing plants supporting local workers and in severe stress to communities even as religion and political beliefs impeded an effective response to the rising crisis. In Syria, a ten year drought spurred armed revolution against a government that turned a blind eye to the needs of its suffering citizens.)
Global Hot Spots
Western US: March saw a brief weakening of the, now 13 month long, blocking high pressure system off the US west coast. This slight interlude unleashed an extraordinary surge of Pacific Ocean moisture that set off record floods and one-day rainfall events throughout Northern California, Washington and Oregon. Pulses of moisture did briefly touch the US Southwest, but the Jet Stream configuration had shifted somewhat northward, resulting in less water relief for the most drought stressed zones.
April-8-2014-US-Drought-Monitor-Map
(The April 8 US Drought Monitor shows drought continuing to intensify over the US despite some moisture reaching affected areas.)
As a result, the epic California drought is probably still the worst seen in 500 years and is now likely to intensify and/or persist on into late this fall. By April 1, snow cover had fallen to 25% of a typical average for the Sierra Nevada. Combined drought and water shortages have led to an unprecedented complete cut off of federal water supplies to many local farmers. In addition, Silicon Valley, has been forced to ration its drinking water supply.
Meanwhile, sections of Texas have experienced their driest 42 month period since record-keeping began in 1911. Regions near Lubbock received only 33 inches of rainfall in the three and a half year period since October of 2010. A normal rainfall for this zone would be around 64 inches for the same time-frame. This makes the current 4+ year Texas drought worse than any previous dry time during the 20th Century, including the Dust Bowl period of the 1930s.
With the emergence of spring, a typical post-winter dry period will likely be enhanced by a continued formation of a powerful dome high pressure system blocking moisture flow to California and the US Southwest. In addition, amplified heat in the up-slope of a high amplitude Jet Stream wave will likely drive drought conditions to rapidly worsen as spring runs into summer. Sadly, the primary hope for moisture comes from the emergence of El Nino, which is becoming more and more likely for later this year. However, if the El Nino comes on as strong as expected, rainfall events are likely to be extraordinarily intense, ripping away top soil from the likely fire-damaged zones and making it difficult for water planners to capture and store water due to its velocity. In the worst case, Ark Storm-like conditions could emerge due to a massive heat and moisture dump that could result in very intense rivers of moisture forming over western regions.
Brazil: Ever since 2005, Brazil has been suffering from a series of persistent drought episodes. By this year, the nine year long drought series reached an ominous peak. Like California, this drought series is now likely the worst seen in decades and possibly as far back as 500 years. The result was widespread fires and blackouts throughout Brazil together with extreme impacts to farm production. Particularly hard hit were coffee and sugar production, sending prices for both markets rocketing to record or near-record levels.
Brazil Drought Rainfall Anomalies
(South American rainfall anomalies from Jan 23 to February 24, 2014. Image source: CPC Unified.)
Indonesia and Southeast Asia: From Thailand to Malaysia to Indonesia, drought resulted in significant reductions in palm oil production, a main crop for the region. Throughout March and into April large fires were reported over a wide drought-stricken zone even as smoke choked both cities and countryside. Some of the fires were suspected to have been illegally set by large palm oil conglomerates seeking to clear new land for an ever-expanding set of palm oil plantations. But the plantations may now be in danger of a drought fed by both their destructive practices of land-clearing and by their overall contribution to an extraordinary and excessive global greenhouse gas overburden.
Fires Malacca Strait 2014
(MODIS shot of widespread fires near the Malacca Strait during March of 2014. Image source:LANCE-MODIS.)
Drought related heat and fires not only threatened crops but also resulted in multiple school closings, numerous dangerous air warnings, thousands of calls reporting peat fires and, in Indonesia alone, more than 20,000 people hospitalized for respiratory problems.
The Ukraine and Russia: An ever-more expansionist Russia’s invasion of the Ukraine also resulted in higher food prices as speculators purchased grain stores over projections that Russian forces could disrupt Urkaine’s food production and exports. First phase invasion into the Crimea did not block key grain ports. But tens of thousands of troops massed along the Ukraine border and likely continued incursions by Russian special forces units into Eastern Ukraine resulted in an ongoing destabilization of one of the world’s key grain producers.
In this context, it is worth noting that global harvest figures showed Russian wheat production falling from 61 million metric tons per year in 2009 to 38 million metric ton per year in 2012. Throughout this four-year period, Russia has been forced to curtail or cut off grain exports on numerous occasions as increasing periods of drought, fire and extreme weather resulted in loss of crops.
Meanwhile, wildfire season began early in Siberian Russia perhaps presaging a fire season that, when combined with the effects of an emerging El Nino, could be the worst seen since 2010 when Russia first cut off grain exports to the rest of the world.
Global Problem: Though the above list provides examples of where global food supply is most threatened by extreme weather related to climate change and/or a related set of conflicts over resources, it is important to note that the current food, resource, and climate crisis is now global in nature. Droughts and severe weather have left almost no region untouched and now result in substantial damage to crops at least once a year in even the most tranquil locations. Instances of ongoing and systemic drought are now common throughout various areas not mentioned above including: Australia, China, South America, Central America, The Middle East, Africa, India, and sections of Russia and Europe. So though blows to important “bread baskets” provide the most impact to overall food price and availability, a general state of agricultural disruption due to increasingly extreme climates blanketing the globe result in a far more challenging than usual base-line for food producers and consumers everywhere.
Links:

Labels: , , , , , , ,