Easy Money
A couple Jills with their eyes on a couple bills
Their eyes was statin'
They was waitin'
To get their hands on some easy money
- Rickie Lee Jones
Greetings
Their eyes was statin'
They was waitin'
To get their hands on some easy money
- Rickie Lee Jones
Greetings
Anyone interested in the oil situation will want to take a look at Gail Tvbergs latest post. (below) She takes a tremendously complex situation and teases out good perspectives on many of the factors involved. Oil production is affected by many factors besides geology , such a the stability of the country, access to markets, the ability of refiners to handle the product, cost of production, the cost of capital, and the price users can afford, among other factors. She offers a glimpse into many of these.
I was particularly interested in her analysis of the impact of the cost of money on US producers. As we all know the federal reserve has lowered interest rates to historic lows. This low cost money has help to finance the current drilling boom No one knows when t interest rates will return to their normal levels, but they may start rising as early as October of this year. If Gail is right, we could start to see a drop off in drilling as the cost of money rises. Without an aggressive drilling program, these new wells go into a steep decline rapidly. Of course, without the US boom, the world would already be at peak production.
Also Ron Peterson runs a nice blog on peak oil- probably the best site since the demise of the oil drum. Here is a nice article concerning our current situation. He focuses mainly on shale, and Russia
Bonus Feature: Professor James Hamilton's latest paper. "The Changing Face of World Oil Markets"
Summary here. paper here
-------


Bonus Feature: Professor James Hamilton's latest paper. "The Changing Face of World Oil Markets"
Summary here. paper here
-------
World Oil Production at 3/31/2014-Where are We Headed?
The standard way to make forecasts of almost anything is to look at recent trends and assume that this trend will continue, at least for the next several years. With world oil production, the trend in oil production looks fairly benign, with the trend slightly upward (Figure 1).

Figure 1. Quarterly crude and condensate oil production, based on EIA data.
If we look at the situation more closely, however, we see that we are dealing with an unstable situation. The top ten crude oil producing countries have a variety of problems (Figure 2). Middle Eastern producers are particularly at risk of instability, thanks to the advances of ISIS and the large number of refugees moving from one country to another.
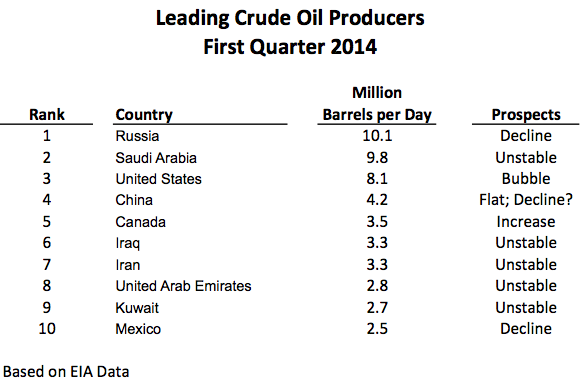
Figure 2. Top ten crude oil and condensate producers during first quarter of 2014, based on EIA data.
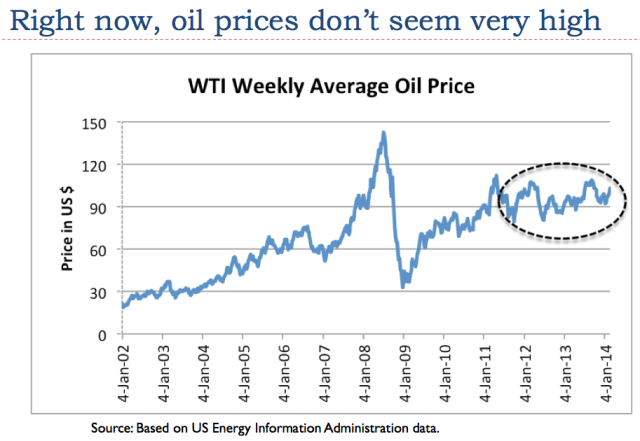
Relatively low oil prices are part of the problem as well. The cost of producing oil is rising much more rapidly than its selling price, as discussed in my post Beginning of the End? Oil Companies Cut Back on Spending. In fact, the selling price of oil hasn’t really risen since 2011 (Figure 3), because citizens can’t afford higher oil prices with their stagnating wages.

Figure 3. Average weekly oil prices, based on EIA data.
The fact that the selling price of oil remains flat tends to lead to political instability in oil exporters because they cannot collect the taxes required to provide programs needed to pacify their people (food and fuel subsidies, water provided by desalination, jobs programs, etc.) without very high oil prices. Low oil prices also make the plight of oil exporters with declining oil production worse, including Russia, Mexico, and Venezuela.
Many people when looking at future oil supply concern themselves with the amount of reserves (or resources) remaining, or perhaps Energy Return on Energy Invested (EROEI). None of these is really the right limit, however. The limiting factor is how long our current networked economic system can hold together. There are lots of oil reserves left, and the EROEI of Middle Eastern oil is generally quite high (that is, favorable). But instability could still bring the system down. So could popping of the US oil supply bubble through higher interest rates or more stringent lending rules.
The Top Two Crude Oil Producers: Russia and Saudi Arabia
When we look at quarterly crude oil production (including condensate, using EIA data), we see that Russia’s crude oil production tends to be a lot smoother than Saudi Arabia’s (Figure 4). We also see that since the third quarter of 2006, Russia’s crude oil production tends to be higher than Saudi Arabia’s.
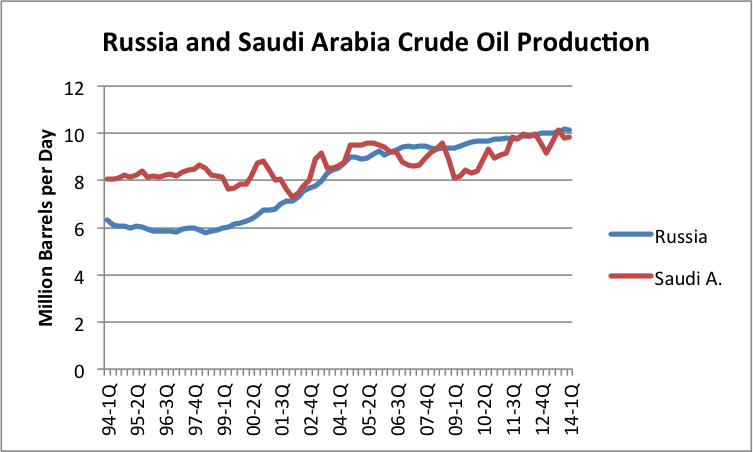
Figure 4. Comparison of quarterly oil production (crude + condensate) for Russia and Saudi Arabia, based on EIA data.
Both Russia and Saudi Arabia are headed toward problems now. Russia’s Finance Minister has recently announced that its oil production has hit and peak, and is expected to fall, causing financial difficulties. In fact, if we look at monthly EIA data, we see that November 2013 is the highest month of production, and that every month of production since that date has dropped from this level. So far, the drop in oil production has been relatively small, but when an oil exporter is depending on tax revenue from oil to fund government programs, even a small drop in production (without a higher oil price) is a financial problem.
We see in Figure 4 above that Saudi Arabia’s quarterly oil production is quite erratic, compared to oil production of Russia. Part of the reason Saudi Arabia’s oil production is so erratic is that it extends the life of its fields by periodically relaxing (reducing) production from them. It also reacts to oil price changes–if the oil price is too low, as in the latter part of 2008 and in 2009, Saudi oil production drops. The tendency to jerk oil production around gives the illusion that Saudi Arabia has spare production capacity. It is doubtful at this point that it has much true spare capacity. It makes a good story, though, which news media are willing to repeat endlessly.
Saudi Arabia has not been able to raise oil exports for years (Figure 5). It gained a reputation for its oil exports back in the late 1970s and early 1980s, and has been able to rest on its laurels. Its high “proven reserves” (which have never been audited, and are doubted by many) add to the illusion that it can produce any amount it wants.
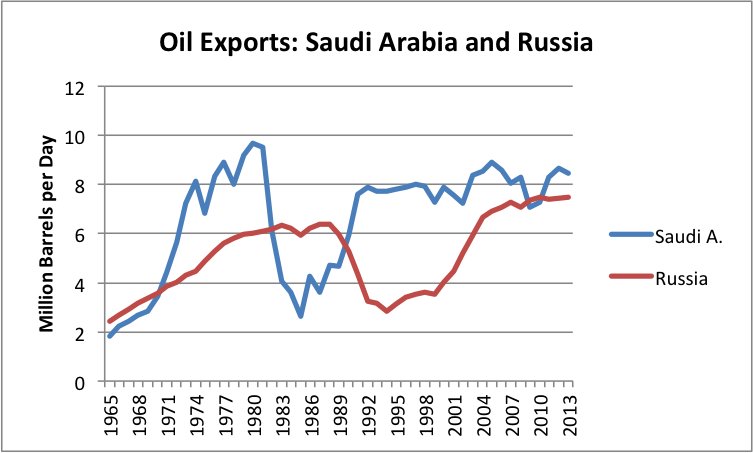
Figure 5. Comparison of Russian and Saudi Arabian oil exports, based on BP Statistical Review of World Energy 2014 data (oil production minus oil consumption). Pre-1985 Russian amounts estimated based on Former Soviet Union amounts.
In 2013, oil exports from Russia were equal to 88% of Saudi Arabian oil exports. The world is very close to being as dependent on Russian oil exports as it is on Saudi Arabian oil exports. Most people don’t realize this relationship.
The current instability of the Middle East has not hit Saudi Arabia yet, but there is increased fighting all around. Saudi Arabia is not immune to the problems of the other countries. According to BBC, there is already a hidden uprising taking place in eastern Saudi Arabia.
US Oil Production is a Bubble of Very Light Oil
The US is the world’s third largest producer of crude and condensate. Recent US crude oil production shows a “spike” in tight oil productions–that is, production using hydraulic fracturing, generally in shale formations (Figure 6).
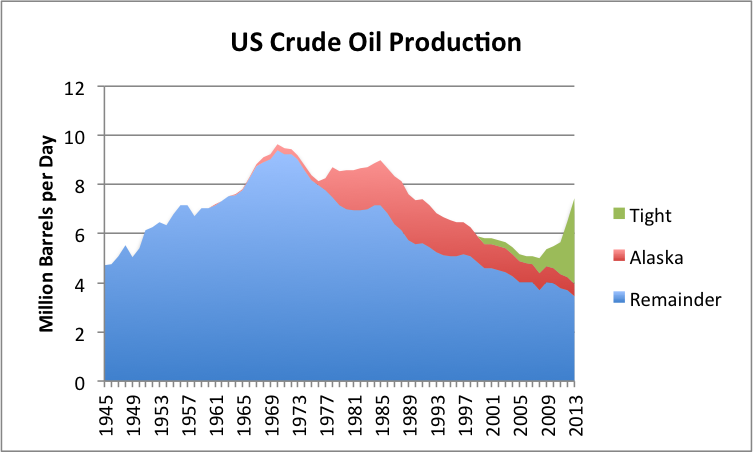
Figure 6. US crude oil production split between tight oil (from shale formations), Alaska, and all other, based on EIA data. Shale is from AEO 2014 Early Release Overview.
If we look at recent data on a quarterly basis, the trend in production also looks very favorable.
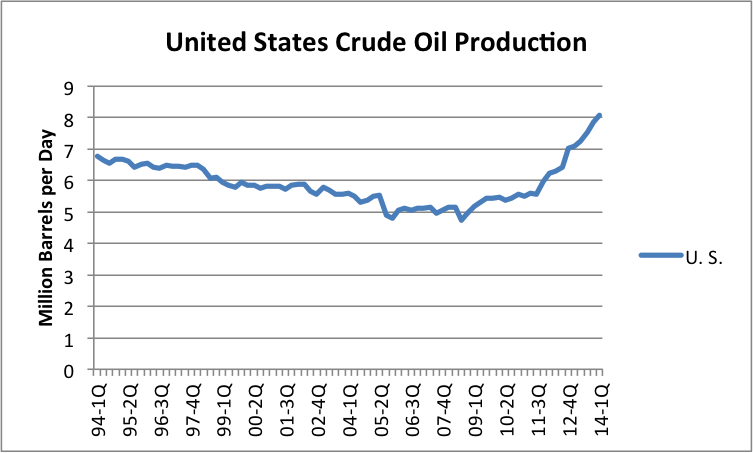
Figure 7. US Crude and condensate production by quarter, based on EIA data.
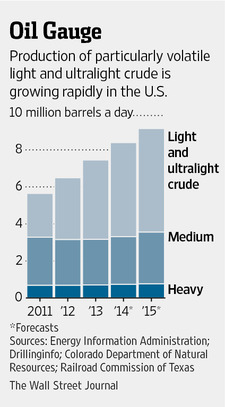
The new crude is much lighter than traditional crude. According to the Wall Street Journal, the expected split of US crude is as follows:

Figure 8. Wall Street Journal image illustrating the expected mix of US crude oil.
There are many issues with the new “oil” production:
- The new oil production is so “light” that a portion of it is not what we use to power our cars and trucks. The very light “condensate” portion (similar to natural gas liquids) is especially a problem.
- Oil refineries are not necessarily set up to handle crude with so much volatile materials mixed in. Such crude tends to explode, if not handled properly.
- These very light fuels are not very flexible, the way heavier fuels are. With the use of “cracking” facilities, it is possible to make heavy oil into medium oil (for gasoline and diesel). But using very light oil products to make heavier ones is a very expensive operation, requiring “gas-to-liquid” plants.
- Because of the rising production of very light products, the price of condensate has fallen in the last three years. If more tight oil production takes place, available prices for condensate are likely to drop even further. Because of this, it may make sense toexport the “condensate” portion of tight oil to other parts of the world where prices are likely to be higher. Otherwise, it will be hard to keep the combined sales price of tight oil (crude oil + condensate) high enough to encourage more tight oil production.
The other issue with “tight oil” production (that is, production from shale formations) is that its production seems to be a “bubble.” The big increase in oil production (Figure 6) came since 2009 when oil prices were high and interest rates were very low. Cash flow from these operations tends to be negative. If interest rates should rise, or if oil prices should fall, the system is likely to hit a limit. Another potential problem is oil companies hitting borrowing limits, so that they cannot add more wells.
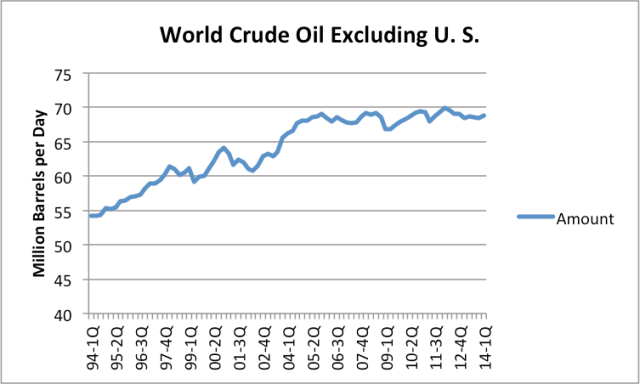
Without US oil production, world crude oil production would have been on a plateau since 2005.
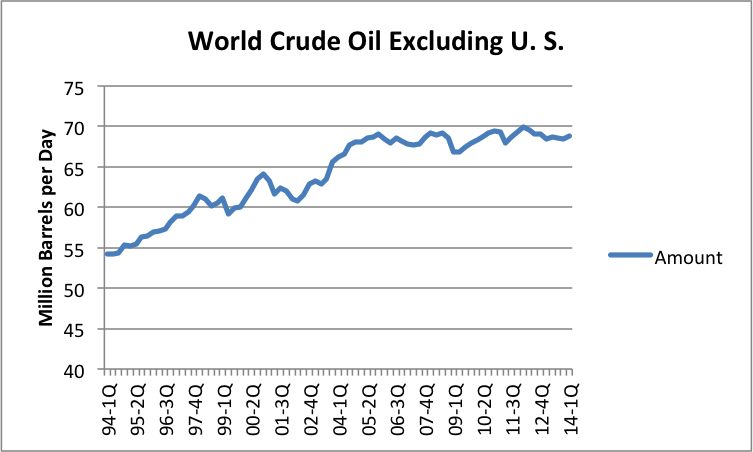
Figure 9. World crude and condensate, excluding US production, based on EIA data.
Canadian Oil Production
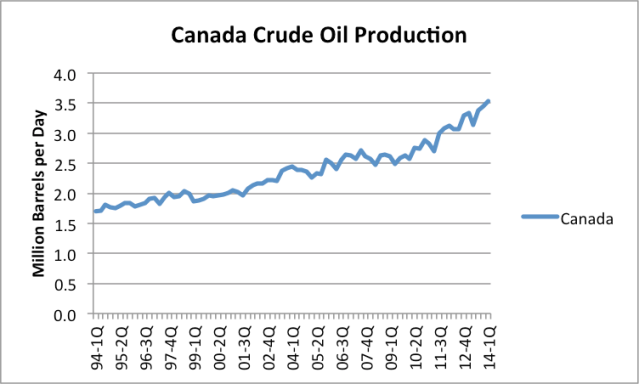
The other recent success story with respect to oil production is Canada, the world’s fifth largest producer of crude and condensate. Thanks to the oil sands, Canadian oil production has more than doubled since the beginning of 1994 (Figure 10).

Figure 10. Canadian quarterly crude oil (and condensate) production based on EIA data.
Of course, there are environmental issues with respect to both oil from the oil sands and US tight oil. When we get to the “bottom of the barrel,” we end up with the less environmentally desirable types of oil. This is part of our current problem, and one reason why we are reaching limits.
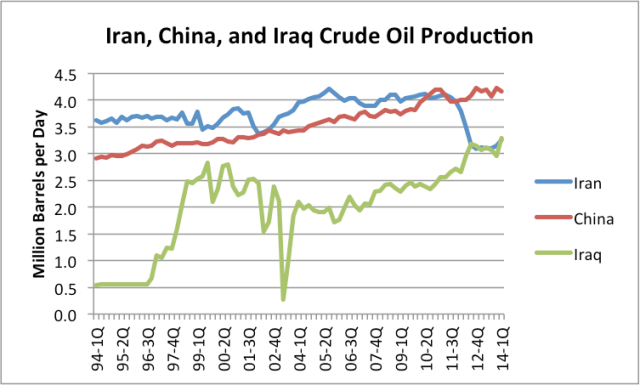
Oil Production in China, Iraq, and Iran
In the first quarter of 2014, China was the fourth largest producer of crude oil. Iraq was sixth, and Iran was seventh (based on Figure 2 above). Let’s first look at the oil production of China and Iran.
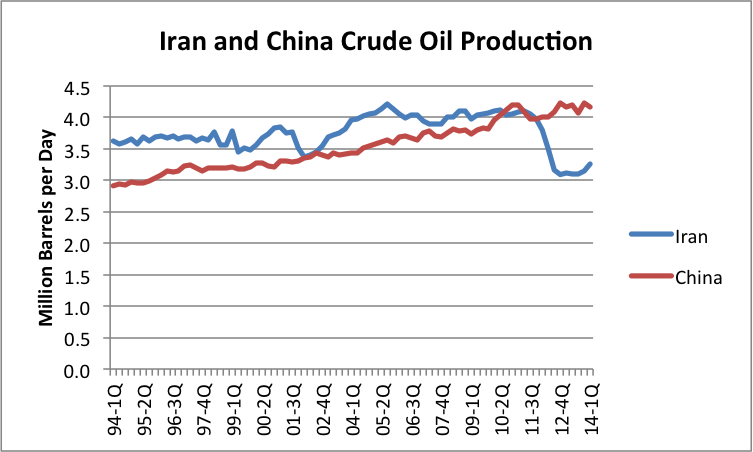
Figure 11. China and Iran crude and condensate production by quarter based on EIA data.
As of 2010, Iran was the fourth largest producer of crude oil in the world. Iran has had so many sanctions against it that it is hard to figure out a base period, prior to sanctions. If we compare Iran’s first quarter 2014 oil production to its most recent high production in the second quarter of 2010, oil production is now down about 870,000 barrels a day. If sanctions are removed and warfare does not become too much of a problem, oil production could theoretically rise by about this amount.
China has relatively more stable oil production than Iran. One concern now is that China’s oil production is no longer rising very much. Oil production for the fourth quarter of 2013 is approximately tied with oil production for the fourth quarter of 2012. The most recent quarter of oil production is down a bit. It is not clear whether China will be able to maintain its current level of production, which is the reason I mention the possibility of a decline in oil production in Figure 2.
The lack of growth in China’s oil supplies may be behind its recent belligerence in dealing with Viet Nam and Japan. It is not only exporters that become disturbed when oil supplies are not to their liking. Oil importers also become disturbed, because oil supplies are vital to the economy of all nations.
Now let’s add Iraq to the oil production chart for Iran and China.
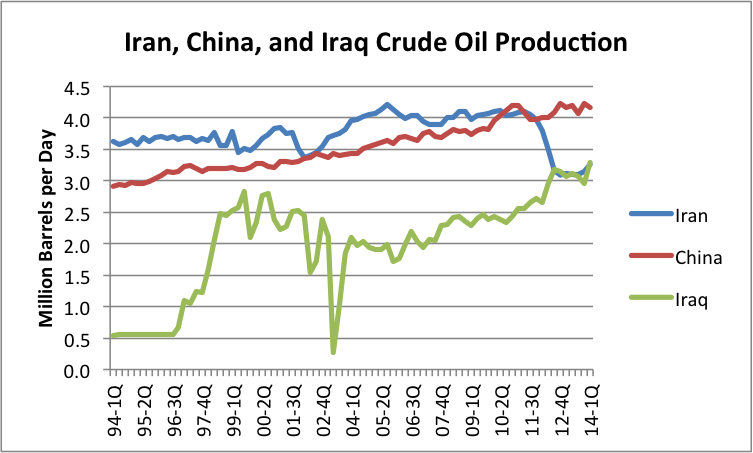
Figure 12. Quarterly crude oil and condensate production for Iran, China, and Iraq, based on EIA data.
Thanks to improvements in oil production in Iraq, and sanctions against Iran, oil production for Iraq slightly exceeds that of Iran in the first quarter of 2014. However, given Iraq’s past instability in oil production, and its current problems with ISIS and with Kurdistan, it is hard to expect that Iraq will be a reliable oil producer in the future. In theory Iraq’s oil production can rise a few million barrels a day over the next 10 or 20 years, but we can hardly count on it.
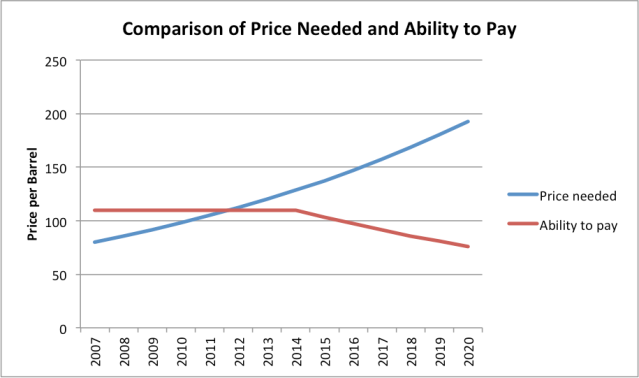
The Oil Price Problem that Adds to Instability
Figure 13 shows my view of the mismatch between (1) the price oil producers need to extract their oil and (2) the price consumers can afford. The cost of extraction (broadly defined including taxes required by governments) keeps rising while “ability to pay” has remained flat since 2007. The inability of consumers to pay high prices for oil (because wages are not rising very much) explains why oil prices have remained relatively flat in Figure 3 (near the top of this post), even while there is fighting in the Middle East.

Figure 13. Comparison of oil price per barrel needed by producers (Brent) with ability to pay. Amounts based on judgment of author.
When the selling price is lower than the full cost of production (including the cost of investing in new wells and paying dividends to shareholders), the tendency is to reduce production, one way or another. This reduction can be voluntarily, in the form of a publicly traded company buying back stock or selling off acreage.
Alternatively, the cutback can be involuntary, indirectly caused by political instability. This happens because oil production is typically heavily taxed in oil exporting nations. If the oil price remains too low, taxes collected tend to be too low, making it impossible to fund programs such as food and fuel subsidies, desalination plants, and jobs programs. Without adequate programs, there tend to be uprisings and civil disorder.
If a person looks closely at Figure 13, it is clear that in 2014, we are out in “Wile E. Coyote Territory.” The broadly defined cost of oil extraction (including required taxes by exporters) now exceeds the ability of consumers to pay for oil. As a result, oil prices barely spike at all, even when there are major Middle Eastern disruptions (Figure 3, above).
The reason why Wile E. Coyote situation can take place at all is because it takes a while for the mismatch between costs and prices to work its way through the system. Independent oil companies can decide to sell off acreage and buy back shares of stock but it takes a while for these actions to actually take place. Furthermore, the mismatch between needed oil prices and charged oil prices tends to get worse over time for oil exporters. This lays the groundwork for increasing dissent within these countries.
With oil prices remaining relatively flat, importers become complacent because they don’t understand what is happening. It looks like we have no problem when, in fact, there really is a fairly big problem, lurking behind the scenes.
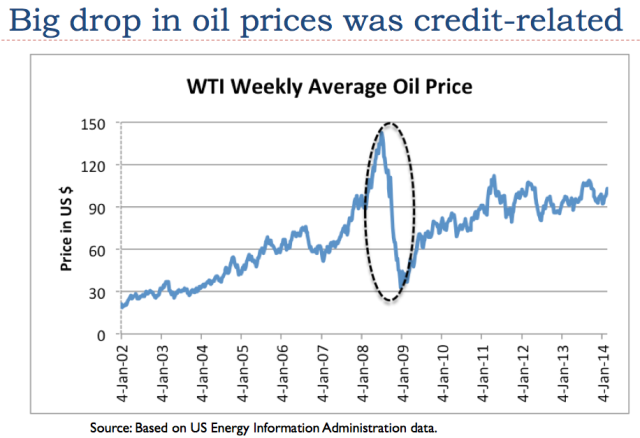
To make matters worse, it is becoming more and more difficult to continue Quantitative Easing, a program that tends to hold down longer-term interest rates. The expectation is that the program will be discontinued by October 2014. The reason why the price of oil has stayed as high as it has in the last several years is because of the effects of quantitative easing and ultra low interest rates. If it weren’t for these, oil prices would fall, because consumers would need to pay much more for goods bought on credit, leaving less for the purchase of oil products. See my recent post, The Connection Between Oil Prices, Debt Levels, and Interest Rates.

Figure 14. Big credit related drop in oil prices that occurred in late 2008 is now being mitigated by Quantitative Easing and very low interest rates.
Because of the expectation that Quantitative Easing will end by October 2014 and the pressure to tighten credit conditions, my expectation is that the affordable price of oil will start dropping in late 2014, as shown in Figure 13. The growing disparity between what consumers can afford and what producers need tends to make the Wile E. Coyote overshoot condition even worse. It is likely to lead to more problems with instability in the Middle East, and a collapse of the US oil production bubble.
Conclusion
I explained earlier that we live in a networked economy, and this fact changes the way economic models work. Many people have developed models of future oil production assuming that the appropriate model is a “bell curve,” based on oil depletion rates and the inability to geologically extract more oil. Unfortunately, this isn’t the right model.
The situation is far more complex than simple geological decline models assume. There are multiple limits involved–prices needed by oil producers, prices affordable by oil importers, and prices for other products, such as water and food. Interest rates are also important. There are time lags involved between the time the Wile E. Coyote situation begins, and the actions to fix this mismatch takes place. It is this time lag that tends to make drop-offs very steep.
The fact that we are dealing with political instability means that multiple fuels are likely to be affected at once. Clearly natural gas exports from the Middle East will be affected at the same time as oil exports. Many other spillover effects are likely to happen as well. US businesses without oil will need to cut back on operations. This will lead to job layoffs and reduced electricity use. With lower electricity demand, prices for electricity as well as for coal and natural gas will tend to drop. Electricity companies will increasingly face bankruptcy, and fuel suppliers will reduce operations.
Thus, we cannot expect decline to follow a bell curve. The real model of future energy consumption crosses many disciplines at once, making the situation difficult to model. The Reserves / Current Production model gives a vastly too high indication of future production, for a variety of reasons–rising cost of extraction because of diminishing returns, need for high prices and taxes to support the operations of exporters, and failure to consider interest rates.
The Energy Return on Energy Invested model looks at a narrowly defined ratio–usable energy acquired at the “well-head,” compared to energy expended at the “well-head” disregarding many things–including taxes, labor costs, cost of borrowing money, and required dividends to stockholders to keep the system going. All of these other items also represent an allocation of available energy. A multiplier can theoretically adjust for all of these needs, but this multiplier tends to change over time, and it tends to differ from energy source to energy source.
The EROEI ratio is probably adequate for comparing two “like products”–say tight oil produced in North Dakota vs tight oil produced in Texas, or a ten year change in North Dakota energy ratios, but it doesn’t work well when comparing dissimilar types of energy. In particular, the model tends to be very misleading when comparing an energy source that requires subsidies to an energy source that puts off huge tax revenue to support local governments.
When there are multiple limits that are being encountered, it is the financial system that brings all of the limits together. Furthermore, it is governments that are at risk of failing, if enough surplus energy is not produced. It is very difficult to build models that cross academic areas, so we tend to find models that reflect “silo” thinking of one particular academic specialty. These models can offer some insight, but it is easy to assume that they have more predictive value than they do.
Unfortunately, the limits we are reaching seem to be financial and political in nature. If these are the real limits, we seem to be not far away from the simultaneous drop in the production of many energy products. This type of limit gives a much steeper drop off than the frequently quoted symmetric “bell curve of oil production.” The shape of the drop off corresponds to (1) the type of drop off experienced by previous civilizations when they collapsed, (2) the type of drop-off I have forecast for world energy consumption, and (3) Ugo Bardi’s Seneca cliff. The 1972 book Limits to Growth by Donella Meadows et al. says (page 125), “The behavior mode of of the system shown in figure 35 is clearly that of overshoot and collapse,” so it tends to come to the same conclusion as well.
Labels: debt, oil bubble, Peak Oil, Russia, tight oil
posted by Walter @ 9:19 AM
0 Comments
![]()

0 Comments:
Post a Comment
Subscribe to Post Comments [Atom]
<< Home