Thursday, July 9, 2015

Atlantis

Way down
Under the ocean
 where I want to be
    -Donovan (Atlantis)
Six feet of water
in the streets of Evangenline
     - Randy Newman

Greetings
       When James Hanson says something, its probably worth listening.  Not only has been looking into these maters longer than most, but he is also willing to tell the unvarnished truth  see e.g Ballad of the sad climatoligists.
      So it was with some interest that I listened to an interview he gave in Australia earlier this year, which I found on Ecoshock).  Here is a transcript of part of it
"The paleoclimate evidence indicates the ice sheets are much more sensitive than the glaciologist, the modellers of ice sheets have indicated and furthermore we now have satellite data over the last 12 years that confirms that ice sheet disintegration is a non-linear process that should not have been surprising, and I have been saying that for 10 years, but now this satellite data confirms that.
The ice sheets are losing mass faster and faster with a doubling the of about 10 years. If that continues, we would get sea-level rises of several metres within 40 to 50 years."
Several meters?   40-50 years?
             This is not what I've been hearing from the IPCC, so it was kind of a rude shock.  But it turns out Hanson has been saying stuff like this for some time.  see here
           While the IPCC sees a sea rise in a gentle upslope,  Hanson sees it as accelerating much faster,..

Hansen sea level rise
(Global sea level rise since 1870. Image source: Dr. James Hansen.)
There may be some support for Hanson's view in recent work.  This from Robert Scribbler's blog (see below)
 For a recent study, headed by Shuang Yi and published on April 30 in Geophysical Research Letters provides evidence that, since 2010, annual rates of global sea level rise have shown a strong uptick. The study, entitled An Increase in the Rate of Global Mean Sea Level Rise Since 2010, notes:
The global mean sea level (GMSL) was reported to have dropped 5 mm due to the 2010/11 La Niña and have recovered in one year. With longer observations, it is shown that the GMSL went further up to a total amount of 11.6 mm by the end of 2012, excluding the 3.0 mm/yr background trend. A reconciled sea level budget, based on observations by Argo project, altimeter and gravity satellites, reveals that the true GMSL rise has been masked by ENSO-related fluctuations and its rate has increased since 2010. After extracting the influence of land water storage, it is shown that the GMSL have been rising at a rate of 4.4 ± 0.5 mm/yr for more than three years, due to an increase in the rate of both land ice loss and steric change.
In short, the study finds an average rate of sea level rise of 4.4 mm per year, or 30% faster than the annual rate from 1992 to 2009, during the period of 2010 to 2013."
    Sea level rise is a function  of both thermal expansion dues to increased temperature, and additional water flows dues to melting Glaciers.  Thermal expansion has been the major factor thus far, but by its nature is  generally slow.  Glaciers on the other hand, can melt rapidly. 
       It all comes down to doubling time.  But every exponential curve starts slow and accelerates.  It difficult at the beginning to see which curve the data is following.  It may be a slowly changing curve or a rapidly changing one.    Thus in one paper Hanson argues.
       The increasing Greenland mass loss ... can be fit just as well byexponentially increasing annual mass loss, a behavior that Hansen (2005, 2007) argues could occur because of multiple amplifying feedbacks as an ice sheet begins to disintegrate. A 10-year doubling time would lead to 1 meter sea level rise by 2067 ... 2045 ... for 5-year doubling time and 2055 ... for a 7-year doubling time.

Obviously we are not preparing for such rapid sea rises.   And it could mean a loss of a lot of coastal property.  See Here  One aspect that I hadn't given much though to, however, is the impact on commerce - the impacts on ports.
   Just to get a feel for how much goes through ports, here is what wiki says
American ports are responsible for moving over 99 percent of the country's overseas cargo.
U.S. ports handle a wide variety of goods that are critical to the global economy, including petroleumgrainsteelautomobiles, and containerized goods. Reports from individual ports indicate that approximately 4.6 million automobiles (imports and exports) passed through American ports in 2006.

The impacts of sea level rise to ports could be significant.  For instance one EPA report states.

The U.S. Department of Transportation (U.S. DOT) initiated another effort to examine the risk to transportation infrastructure from climate change along the Atlantic coast. The study is identifying the transportation infrastructure that, without protection, will regularly be inundated by the ocean or is at risk of periodic inundation due to storm surges. Phase 1 of the report, covering Washington D.C., Maryland, North Carolina, and Virginia, was released in December 2007. In the state of Maryland, the study found that 28% of port acreage would be regularly inundated or at risk of periodic inundation if sea levels rose just 6 cm (2.4 inches)

However the Gulf Coast ports are more significant to the national economy. Noaa points out

"Along the Northern Gulf Coast, an estimated 2,400 miles of major roadway and 246 miles of freight rail lines are at risk of permanent flooding within 50 to 100 years as relative sea level is expected to rise in the range of 4 feet (Figure 1). The Gulf Coast is particularly at risk to service disruptions due to a transportation network that is interdependent and relies on minor roads and other low-lying infrastructure. The Gulf Coast is home to seven of the ten largest commercial ports (by tons of traffic) in the country. The region also hosts a significant portion of the U.S. oil and gas industry, with its offshore drilling platforms, refineries, and pipelines. Roughly two-thirds of all U.S. oil imports pass through the Gulf. Sea level rise would potentially affect commercial transportation activity valued in the hundreds of billions of dollars annually through inundation of area roads, railroads, airports, seaports, and pipelines (U.S. Global Change Research Program, 2009). Figure 1 shows the Gulf Coast area roads at risk from sea-level rise.


EPA says
"Looking particularly at the impact of storm surges, the Gulf Coast Study determines the percentage of marine transportation facilities in an area from Mobile, AL to Galveston, TX that would be affected by certain levels of storm surges. The study predicts that relative sea levels in the region will rise between 0.3 and 7 feet, depending on location, over the coming century. Average temperatures in the region are likely to increase between 0.9°F and 4.5°F over the next fifty years.11 The study provides probabilities for some impacts at the regional level. For example, if relative sea levels rise 4 feet, 72 percent of ports in the region will be at least partially inundated.
So, Hanson's conclusion looks pretty accurate.  
"So spell that out for us James before we move on, sea level rises of several meters in forty years, what would that look like in terms of our lives
The consequences are almost unthinkable. It would mean that all coastal cities would become dysfunctional, some parts of the cities would still be sticking above the water but they would not be habitable, so the economic implications are incalculable. We really cannot go down that path, this is an issue of intergenerational injustice.   It’s a moral issue because the current generation is burning the fossil fuel and getting the benefits and creating a situation that for young people, our children and grandchildren and future generations is going to have enormous consequences."


For an interesting interactive map of pontential flooding, see here 


Global Sea Level Rise Going Exponential? New Study Records Big Jump in Ocean Surface Height

From about a thousand years ago through to the mid 19th Century, global sea levels remained remarkably stable. Together with overall global temperatures, sea surface heights stayed at about the same levels until the late 1800s. At that time, an initiation of large-scale burning of oil, gas and coal dumped heavy volumes of greenhouse gasses into the atmosphere. The Earth System began to warm and seas began a slow upward climb.
Hansen sea level rise
(Global sea level rise since 1870. Image source: Dr. James Hansen.)
At first, the pace of sea level rise was minor — only hitting about 0.8 mm per year. But then, by around 1925, the rate of sea level rise more than doubled to 1.9 mm per year. The oceans, which at first only slowly accumulated heat, began a long term warming which eventually extended through almost every depth and region. This pace maintained until about 1992 when the oceans again hit a higher rate of rise at around 3.1 mm per year — a pace that then included a small but ominously growing portion of glacial melt.
Now, it appears that global warming is again pushing sea levels to rise even faster. As, over recent years, a number of ominous indicators pointed toward yet another surge in ocean surface levels.
All over the world’s frozen regions, the great land glaciers — especially in Greenland and Antarctica — have been destabilizing. Melting, cracking, and clamoring as their gargantuan, mountain-like forms assembled in an ever-speeding march to the seas. This great rush of freshwater melt and ice is already causing an ocean-threatening slow-down of Atlantic circulation. And in the Southern Ocean surrounding Antarctica an ominous bulge of water near the southern polar zone became an indicator of an increasing rate of melt from some of the largest glaciers on Earth. A bulge that was 2 centimeters higher than the global average along melting and thawing Antarctic shores.
Global Sea Level Rise On Upward Curve?
Recently, the global sea level rise measure — AVISO — also took an unsettling leap. With satellite captures of the world ocean showing a strong surge in sea level rise throughout 2014 and into 2015. A spike that displays vividly as a hockey-stick like jog at the tail end of the measure below:
Aviso sea level rise
(Big spike in sea level rise plainly visible in the AVISO measure. Image source: AVISO.)
It’s an upward jump representing nearly a 1 centimeter spike in the rate of sea level rise over the past six months.
By itself, this jump in sea level would be something to worry over. But new findings paint an even starker picture. For a recent study, headed by Shuang Yi and published on April 30 in Geophysical Research Letters provides evidence that, since 2010, annual rates of global sea level rise have shown a strong uptick. The study, entitled An Increase in the Rate of Global Mean Sea Level Rise Since 2010, notes:
The global mean sea level (GMSL) was reported to have dropped 5 mm due to the 2010/11 La Niña and have recovered in one year. With longer observations, it is shown that the GMSL went further up to a total amount of 11.6 mm by the end of 2012, excluding the 3.0 mm/yr background trend. A reconciled sea level budget, based on observations by Argo project, altimeter and gravity satellites, reveals that the true GMSL rise has been masked by ENSO-related fluctuations and its rate has increased since 2010. After extracting the influence of land water storage, it is shown that the GMSL have been rising at a rate of 4.4 ± 0.5 mm/yr for more than three years, due to an increase in the rate of both land ice loss and steric change.
In short, the study finds an average rate of sea level rise of 4.4 mm per year, or 30% faster than the annual rate from 1992 to 2009, during the period of 2010 to 2013. For these, more rapidly rising, sea levels the study identifies clear causes. The first is an increasing rate of land ice loss. The second is what is termed as ‘steric change’ — a scientific phrase that both identifies ocean thermal expansion due to warming combined with changes in ocean salinity, which also impacts sea surface height.
The April 30 study did not include the more recent sea level rise spike now showing up in the AVISO measure. So, at least for now, sea levels do appear to be sliding up some rather dangerous curves.
Hitting the More Difficult Rates of Sea Level Increase
Such a jump has stark implications for sea level by end century. A 4.4 mm per year rate of rise would equal just less than half a meter of increased sea level within one Century. This compares to the previous rate of rise which would have resulted in a 1 foot global jump within a one hundred year span.
A jump of this kind was, however, predicted with sea level rise by end of this Centuryexpected to hit between 0.5 and 1 meters of increase in the IPCC measure and between 5 and 6 feet in US Coast Guard studies (most studies find a range between 3-9 feet for this Century). The 4.4 mm per year increase is rather ominous in that it already puts annual rates of rise in the IPCC mid-range. An early ramp up with fully eight and a half decades left to go in a Century that will certainly see substantial further increases in global heat accumulation.
Composite
(South Florida 6 meters of sea level rise before [left frame] and after [right frame]. Note that second image is an artist’s rendering based on flood analysis showing what a 6 meter sea level rise would look like for South Florida, should it occur. Image source: Tropical Audobon Society.)
Many planners use the IPCC measure or even more conservative indicators to prepare for sea level rise at their city, county and state shores. And the fact is these indicators may fall well short of reality at the coastlines. A stark circumstance that will become more and more difficult to manage as time moves forward.
Overall, a 2010 ramping in the rate of sea level rise is a bit soon. Similar further jumps leading up to potential worst case 1-4 cm per year levels would initiate a combination of dangerous impacts including untenable rates of rise for coastal regions, severe shocks to ocean circulation systems and overall ocean health, and potentially very dangerous impacts to the world’s weather. To this point Hansen’s paper entitled ‘Greenland Ice Sheet Mass Loss, Exponential?‘ is well worth a (re)read.
Similar Climate Conditions Saw 20 Meter Surges in Sea Level Due to Glacial Melt
With current greenhouse gas levels now in the range of 400-405 parts per million coinciding with substantial jumps in glacial melt and sea level rise, it may be worth taking a look back at times in the geological past when atmospheric heating conditions were similar to those seen today. The last time heat trapping gasses were seen at such high concentrations was at the height of the Pliocene warming 3-5 million years ago. That time saw temperatures in the range of 2-3 degrees Celsius warmer than Holocene averages. It was also a geological period that saw Antarctic and Greenland melt events that pushed seas up to 20 meters higher.
We are exceeding maximum Pliocene atmospheric CO2 thresholds at this time (well exceeding if you count in a 485 CO2 equivalent forcing from all greenhouse gasses added by human beings). And we will almost certainly enter Pliocene warming levels this century. So the melt pressure we are putting on the world’s ice sheets is likely to at least be in the 20 meter range for the (hopefully) longer term.

Labels: , , , , ,

Saturday, July 12, 2014

Have the Plutocrats Figured It Out?

Once upon a time you dressed so fine
Threw the bums a dime, in your prime
Didn't you?
   - Bob Dylan ( Like a Rolling Stone ) 


I ain't no fortunate one.

     Creedence Clearwater (Fortunate Son) 


Greetings

         Well, the plutocrats are joining the party.  Listen below as various billionaires, and former cabinet members, explain the problems associated with climate change.   (see below)  Take a listen at ecoshock.   See the  report "Risky Business" here.   See a review here

      (One aspect I haven't given much thought to was the idea that it would be too hot to go outside during the day.  So we'd have to move into caves, and only come out at night.  Holy climate change Batman! )

        I think its great that our "betters" are coming on board.  They've got two out of three  - its here, and its human caused.  What I wonder about, though is number three - the one that's toughest to swallow -  what it takes to stop making it worse.   Even assuming that we have some of our " carbon budget" remaining to burn up ( but see here), the economic implications of only staying under the budget are not good.   Not merely no growth, but a shrinking economy - "degrowth" according to Kevin Anderson.. see here   If that is part of their program, it wasn't mentioned in the press conference.

      I hate to be cynical, but this just reminds me too much of one of Bruce Wayne's charity galas.   Where the elite meet, and slap each other on the back, and tell each other they are doing good.  Now Bloomberg, and Hank Paulson can hop on their jets and fly of to Martha's Vineyard, or Davos, or wherever the right people are going this season.

     I'd like to say "it's a step in the right direction.", but these folks don't propose a program, so I can't tell what direction they are heading!
     
   Bonus Stuff:   Hear Alex Smith's song "Too Hot"and help it go viral !
                           Hear an interview with Stuart Saniford of Oil Drum fame
                           Hear an interview with Dr Peter Wadhams, on the likely impacts of a methane burp.
                       

------

CRASHING CLIMATE NEWS

NOTICE! On Thursday July 10 the Radio Ecoshock server is having technical problems.Please download or listen to the new show from SoundCloud here:https://soundcloud.com/radioecoshock/crashing-climate-news

SUMMARY: Plutocrats admit U.S. economy is "Risky Business" during climate change. It will not be safe to go outside. Cambridge Polar expert Peter Wadhams on Arctic methane burst. New climate song "Too Hot". Radio Ecoshock 140709

Four years ago, on Radio Ecoshock I asked if planet Earth could get so hot, it would be dangerous for most humans to go outside on many days of the year.

Now far too soon, a new report called "Risky Business" explains the majority of Americans will experience days too hot to go out for more than an hour or so, without suffering heat stroke. Many will die. In just the South East region of the United States, by the end of this century there will be somewhere between 11,000 to 36,000 more heat deaths every year. They'll get about 130 days a year, four months, of extreme temperatures.

In the United States, as in many other parts of the world, there will be huge economic losses. Crop yields will fall as much as 50%, with some foods disappearing. It will be too hot outside to work in the fields. In fact all outdoor work, from construction to forestry, may have to be done at night.

That's the start of a long-term trend where humans may have to become more nocturnal, and build more underground, just to survive temperatures so hot they have only appeared once before on this planet. Our early mammal relatives survived only underground.

Here is what makes this report doubly shocking: it's published by top business leaders and finance experts, including Republicans. When the 1% who own most of the wealth in the world realize their own money and real estate are threatened by global warming, you know we are in trouble. But maybe that could be the turning point where we finally see some real action to move away from fossil fuels, deforestation, and agribusiness that pollutes the atmosphere with dangerous gases.

Download or Listen to this Radio Ecoshock show in CD Quality (56 MB) or Lo-Fi(14 MB)

Or listen to it now on Soundcloud.


ONE OF THE BIGGEST CLIMATE STORIES THIS YEAR!

I play you key short clips from the report press conference. You will hear former Bush Treasury Secretary Hank Paulson say the climate threat to the economy is far greater than the 2007-2008 economic crash he helped stave off. The famous New York City MayorMichael Bloomberg, himself a billionaire, explains we are heading into climate catastrophe. John Hopkins specialist Dr. Al Summers explains how heat deaths work. And Clinton Treasury Secretary Bob Rubin warns we may not even be aware of the worst to come.

Along those lines, I'll also be playing you a the audio from a new interview of Cambridge Polar expert Dr. Peter Wadhams. He says civilization is unlikely to survive if a 50 gigatonne release of methane burps out of the rapidly warming Arctic. Two scientists, one American, one Russian, have explained how that is quite possible.

Then we'll dive into the Radio Ecoshock archives, where I interview bloggers John Cook of Skeptical Science, and Stuart Staniford of Early Warning, about the science of human tolerance for heat and humidity.

I hope to have time to squeeze in my new climate song "Too Hot" - which I hope you can use as a tool to reach more people.

BUSINESS AS USUAL IS THE RADICAL GAMBLE WITH OUR FUTURE CLIMATE!

Let's get busy, with the opening remarks by Hank Paulson for the report "Risky Business,The Economic Risks of Climate Change in the United States."

This is Radio Ecoshock. We are listening to remarks made at the press release June 24th, in New York City of a stunning report on climate, human health and the economy. It's called "Risky Business". Next up is former Clinton Treasury Secretary Robert Rubin. Bob Rubin was also CEO and co-Chair of Goldman Sachs, as well as a Board member at Citigroup.

Henry Cisneros was the first Hispanic-America Mayor of San Antonio Texas, and served as Secretary of the U.S. Department of Housing and Urban Development, or HUD, in the Clinton Administration. He's now Chairman of the CityView companies. Finally, someone in the real estate industry speaks up about the coming price carnage coming as multi-million dollar coastal properties become worthless due to rising seas and extreme storm surge.

Eventually most of Florida real estate will go under, along with the land. The Risky Business report suggests between $238 billion and $507 billion of coastal property will be lost to the sea.

Al Sommers, is the Dean Emeritus of the Bloomberg School of Public Health at John Hopkins University. Here's the short and bitter explanation of how humans die from heat.

Dean Sommers told the press: “Montana summers will soon be the same as New Mexico today.” It will become impossible to be outside there without some kind of air-conditioned suit for about 20 days a year.

Greg Page, the executive chairman of the world's largest grains company Cargill, also spoke, but frankly he used public relations talk, extolling the can-do powers of farmers to adapt to climate change. In my opinion, even Superman can't grow crops when the rain doesn't fall, or extreme heat or floods wipe out the fields.

Others who have made statements supporting this report include former United States Senator Olympia Snowe, billionaire environmental supporter Tom Steyer, and Bush-era Secretary of State and of the Treasury, George Shultz. Professor of Political Science and President of the University of Miami, Donna Shalala minced no words on the clear threat posed by climate change to her state. You can find links to all the videos, statements, and the report in my Radio Ecoshock blog at ecoshock.info. Or go to riskybusiness.org.

RISKY BUSINESS REPORT LINKS (Executive summary, press video etc)

"RISKY BUSINESS"

Executive Summary here.

Find risks in your own part of the United States here.

Press release video: http://riskybusiness.org/blog/risky-business-press-conference-live-stream [recorded for this show, with notes]

Joe Romm's take here.

Reuters article here.

More here from Bloomerg and here from UK's Daily Mail (with some good graphics).

I CAN HARDLY BELIEVE BIG MONEY HAS WOKEN TO THE CLIMATE DANGER

As I write this, it is 101 degrees F, 38 degrees C outside my door. I don't know about you, but I wasn't sure I'd live to hear top financial experts from both political parties admitting global warming is becoming an almost unstoppable catastrophe that will threaten the entire wealth structure of America and the world. I feel vindicated and even more worried at the same time.

Even by 2050, not all that far away, the average American will experience tow or three time more days over 95 degrees, or 36 Celsius. By the end of the century, that becomes about 3 months of such weather.

So what you say? First, a warmer atmosphere holds more water. This higher humidity will combine with higher temperatures to kill many of us. We can only sweat ourselves cool enough to avoid heat stroke if the heat and humidity are below certain levels. We'll find out more about that later in this program. Second, if you think air-conditioning will handle it all, consider our grid and power sources are already at the breaking point in hot weather. The price of oil, coal and gas will continue to go up as we go beyond the peak of what can be produced at reasonable prices.

We can't burn all those fossil fuels anyway, without completely roasting out the planet. Can we really expect solar and wind power to cool off all our inefficient shopping malls, office towers, homes and industrial plants? I doubt it.

THE METHANE EMERGENCY REMAINS POSSIBLE

Bob Rubin raise the problem of extreme changes that are not even quantified by the official Intergovernmental Panel on Climate Change. There's plenty of news from the Arctic to back that up. I could spend 3 programs just updating you on the hot Arctic, the super-heat-cell hovering over Siberia, and the giant forest fires there. But here is the head of the Head of the Polar Ocean Physics Group at Cambridge University, UK, Dr. Peter Wadhams, being interviewed by Nick Breeze for the Arctic Methane Emergency Group.


Watch that interview on You tube here.

Find the Arctic Methane Emergency Group here.

Will we get that 50 gigaton burst of methane? No one knows for sure. It could all come down to good luck, or an undersea land-slide or quake. Meanwhile, as Wadhams says, we do know more and more methane is leaking out of the frozen methane clathrates as the Arctic sea warm to extraordinary temperatures, especially with no sea ice covering. We won't even get into the methane clouds rising from land sources as the permafrost melts.

HOW HEAT KILLS

This is the Radio Ecoshock summer special on extreme heat.

Let's get the mechanics of how humans cool themselves, and why we may not be able to in a hotter and more humid world. We'll start with a slightly shortened version of my 2010 interview with John Cook, host of the popular Skeptical Science blog and video series.

Listen to or download the full John Cook interview here.

Don't forget our interview on climate and human health with Dr. Elizabeth Hanna from Australian National University. That's from our show November 27th, 2013. Here's a quick clip of Dr. Hanna on the response of the human body to extreme heat.

Download/listen to this 20 minute interview with Dr. Hanna in CD Quality orLo-Fi.

Read more about Elizabeth Hanna with links here.

Back in 2010, another enquiring mind, Stuart Staniford, looked into human trying to work in extreme heat in Pakistan. The difference of course is Pakistan has a dryer heat, whereas the rest of us will get a deadly double-dose of heat AND high humidiy. Staniford is the host of the Early Warning blog. Find the link for the full interview here.

That was Stuart Staniford, from our Radio Ecoshock interview June 11th, 2010. Find Stuart at earlywarn.blogspot.ca. Although he hasn't been blogging since January.

Radio Ecoshock was literally years ahead of the mass media in covering this issue. Be sure to stay tuned as we cover climate change and our future, as no one else does.

Find all our past programs, most of them as valid as the day they were born, as free mp3 files at our web site, ecoshock.org.

NEW SONG FROM ALEX SMITH: "TOO HOT"

So here is that song, just right for today's news and the news of tomorrow. It's called "Too Hot". I wrote this song using Ableton Live, a computer synth voice called "Blue Vox", plus voices from TextAloud.

Please forward links to this song to all your friends, and contacts in social media. We need a Twitter and Facebook barage to get out the music of climate change, and the word about this radio program. Thank you for demanding for a better world. Here is the link to share. [ https://soundcloud.com/radioecoshock/too-hot ]

Labels: , , , , , ,

Tuesday, July 1, 2014

Maesurables


It's getting better all the time
- The Beatles

Ooops, I did it again
      -Brittney Spears

Greetings

     Mark K likes to say that you can't change what you can't measure.   Here's our report card.   
       I'd like to say its a mixed bag, but ..   More coal, more renewables, but even more fossil fuels.   To me the most telling to me is the "carbon intensity".   The only way we can "have our cake and eat it too"  is to get more energy with less carbon.     That's not really happening. See below .

      How about a "turning point" ? Maybe things are getting worse, but not as fast as they used to be?    I took a look at Mauna Loa.  They have a nice chart showing the CO2 trends.  While it seemed to slow a little in the 1990's, since then growth in CO2 has increased pretty steadily,   Last year it was   see here

      How about on the other end?   Thanks to Ecoshock radio,  I recently stumbled across David Spratt's  analysis of the "carbon budget".    Spratt,  ,the author of Climate Code Red,  argues that the climate budget is set too high, because it  only gives us a 60% chance of staying under 2 degrees.   Would we get in a car, or plane, if we knew we had a 40% chance of an accident?  He argues that if we  set the limit at 90% would make more sense.  But using that probability, we would have already used up our carbon budget.  see here   Spratt's suggestion: 

We now have a choice to make: accept much higher levels of warming of 3–5°C that will destroy most species, most people and most of the world's ecosystems; a set of impacts some more forthright scientists say are incompatible with the maintenance of human civilisation.

Or we can conceive of a safe-climate emergency-action approach which would aim to reduce global warming back to the range of conditions experienced during the last 10,000 years, the period of human civilisation and fixed settlement. This would involve fast and large emissions reduction through radical energy demand reductions, whilst a vast scaling-up of clean energy production was organised, together with the remaking of many of our essential systems such as transport and food production, with the target being zero net emissions. In addition, there would need to be a major commitment to atmospheric carbon dioxide drawdown measures. This would need to be done at a speed and scale more akin to the "war economy", where social and economic priority is given to what is perceived to be an overwhelming existential threat.


------------------


There's a fair bit of optimism in green circles that fossil fuels are dying and renewables like wind and solar are set to take over. Al Gore has a hopeful new essay in Rolling Stone along these lines, arguing that "a powerful, largely unnoticed shift is taking place."
IN 2013, FOSSIL FUELS PROVIDED 87% OF THE WORLD'S ENERGY — THAT HASN'T CHANGED SINCE 1999
One problem? It's hard to see this shift in the numbers — at least so far. Yes, solar panels are getting cheaperand coal is on the wane in the United States. But the growth of fossil fuels in Asia is still swamping those clean-energy trends. The result: more carbon-dioxide emissions and more global warming.
Here's a simple way to see this: In 2013, coal, oil, and natural gas provided 87 percent of the world's energy. That fraction hasn't changed since 1999. The world has basically made zero progress in moving away from fossil fuels over the last 15 years. If we want to slow the pace of climate change, that has to shift very drastically.
Those numbers come from BP's new Statistical Review of World Energy 2014, which is worth a careful read for anyone interested in the global energy system. I've put some of their data in chart form to tell the story below:

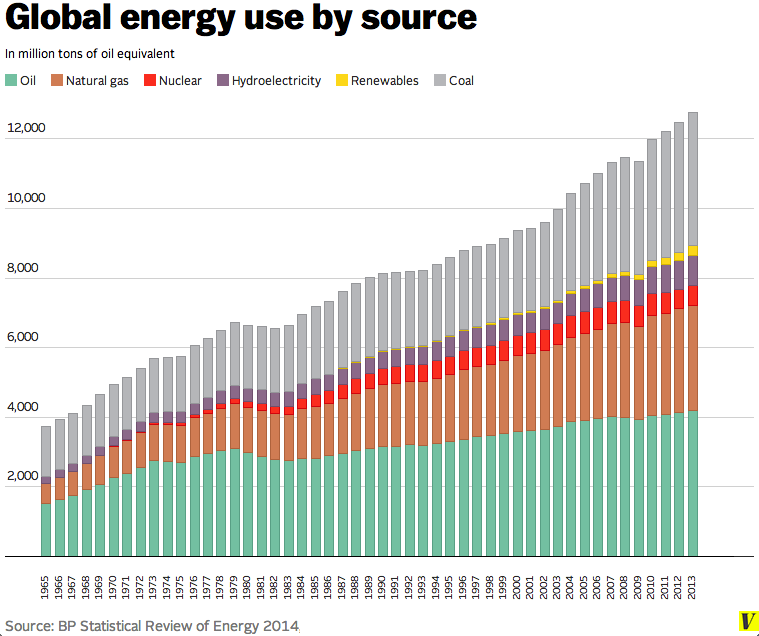
1) Clean energy is growing worldwide. But fossil fuels have grown even faster.

Global_energy_use_by_source__new_
As the world grows, it keeps using more and more energy. And fossil fuels still supply the vast majority of that energy. Oil remains the dominant source of fuel for our cars, trucks, and airplanes. And coal and natural gas are the leading sources of electricity.
THE WORLD ADDED TWICE AS MUCH COAL LAST YEAR AS RENEWABLE ENERGY
All told, fossil fuels made up 87 percent of the world's energy consumption in 2013. By contrast, low-carbon sources — including nuclear, hydropower, wind, solar, and biomass — made up just 13 percent.
That ratio hasn't changed since 1999, as the University of Colorado's Roger Pielke Jr. points out.
So, yes, clean energy sources have been rising over time. That little yellow sliver showing renewable energy is growing at rapid clip. But coal, natural gas, and oil have more than kept pace.
One illustrative example: over the last year, renewable energy grew by 38.5 TOE (tons of oil equivalent). But coal grew by 103 TOE, more than twice as much.

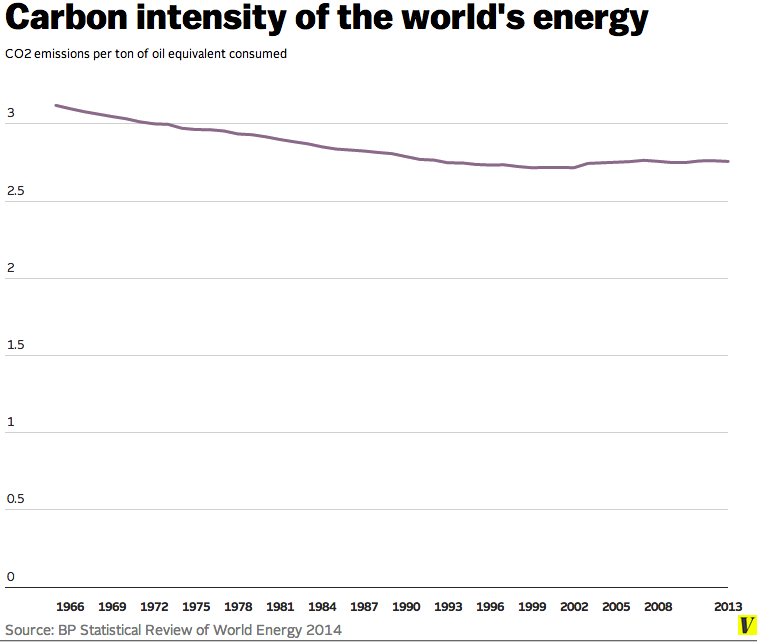
2) The world's energy system hasn't gotten any cleaner since 1999

Carbon_intensity_of_global_energy
Here's another way to view the same trend. The chart above shows the amount of carbon-dioxide the world generates for every unit of energy it consumes. This is "carbon intensity," and it's a good way to measure how "clean" the world's energy system is.
IF WE WANT TO TACKLE CLIMATE CHANGE, CARBON INTENSITY HAS TO DROP — A LOT
For decades, the world was making gradual progress here: In 1966, the world emitted 3.1 tons of carbon-dioxide for every unit of energy it consumed. By 1999, that had declined to 2.71 tons.
But then progress halted — particularly as China went on a massive coal-fueled growth binge. By 2013, the carbon intensity of the world's energy had actually risen to 2.76 tons of carbon dioxide per unit of energy.
If the world wants to seriously tackle global warming, then it's not enough to have a bit of progress in clean energy here or there. Instead, the carbon intensity figure in the chart has to drop very, very, very drastically. That's especially true given that the world is likely to keep consuming more and more energy as it gets richer.
Over at his site, Pielke runs some rough numbers on this. If humanity wanted to boost its energy use by 50 percent and cut carbon-dioxide emissions by 50 percent, then the carbon intensity of energy would need to fall to one-third of what it is today.
In other words, the entire world's carbon intensity would have to fall from 2.76 tons of CO2 per unit of energy down to 0.9 tons or so. That's a notch below the carbon intensity of Norway (0.99 tons). Basically everyone would have to copy Norway.
That's a tough task — especially since we seem to be going in the opposite direction:

3) The world is using more coal than ever before

Global_coal_consumption
Burning coal for electricity is the leading source of carbon-dioxide emissions — and coal use keeps growing rapidly. Back in the 1980s, coal supplied just 10 percent of the world's energy. Now it supplies about 30 percent.
CHINA NOW CONSUMES 50% OF THE WORLD'S COAL
There are regional variations here. Coal use has actually declined in North America and Europe since the late 1980s, as countries have shifted to natural gas and other cleaner sources of electricity.
But at the same time, coal use skyrocketed in Asia, which is growing fast and is now responsible for 70 percent of coal consumption. (China alone is responsible for a little over 50 percent.)
True, this may not last forever. Lately there have been some signs that China's coal habit will quit growing in the years ahead. But most of China's coal plants are still relatively young, which means they can operate for decades to come. It's difficult to envision that China's coal use will decline significantly anytime soon.

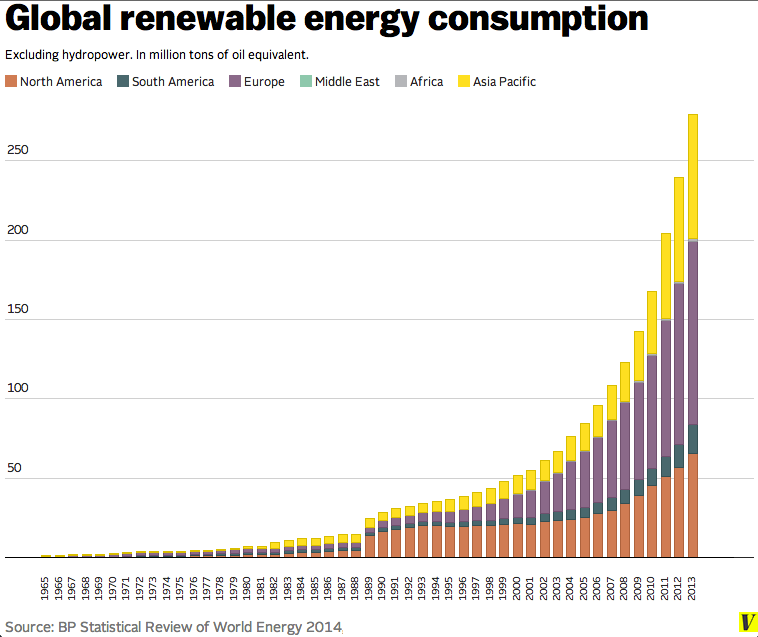
4) Renewable power is surging, but it's still relatively small

Global_renewable_energy_use
Now, it is true that clean energy is on the rise. The chart above shows all renewables apart from hydropower: so that includes biomass, biofuels, geothermal, wind, and solar. And there's a clear acceleration in recent years.
BIOFUELS AND BIOMASS STILL DOMINATE AMONG RENEWABLES
Wind and solar are growing especially fast. They provided 3.2 percent of the world's electricity in 2013, and accounted for 27 percent of the growth in electricity generation.
But renewable energy is still a small part of the global energy mix. In 2013, renewables around the world provided just one-tenth of the energy that natural gas did. Growth in renewables will need to accelerate in the future to shake the dominance of fossil fuels.
(By the way, most renewables are actually biofuels and biomass, as Robert Wilson explains at The Energy Collective. That's a key caveat, since there are good arguments that burning wood for electricity or converting corn into ethanol isn't all that environmentally friendly.)

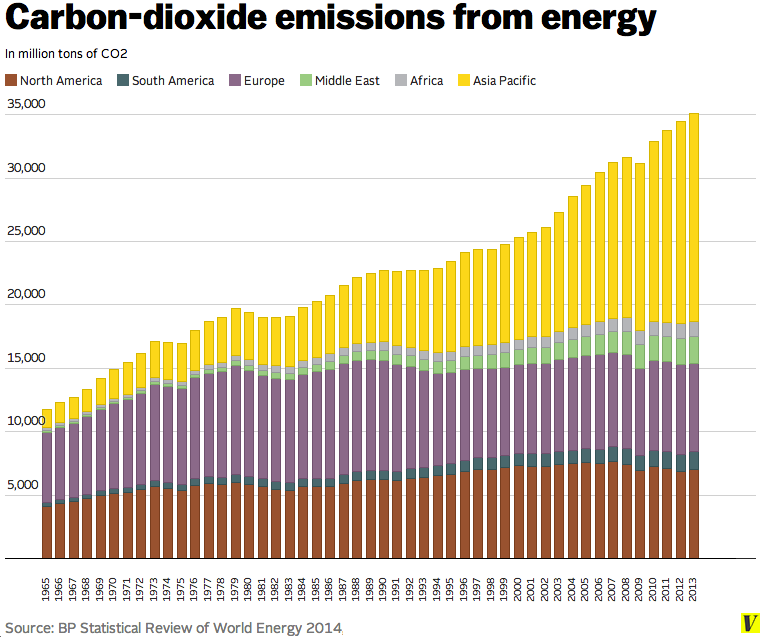
5) As a result, global carbon-dioxide emissions keep rising

Carbon_dioxide_emissions
And as fossil fuels expand, so do global carbon-dioxide emissions, which rose 2.1 percent between 2012 and 2013 — a rapid clip even during a period of relatively slow economic growth.
HALF THE WORLD'S EMISSIONS NOW COME FROM ASIA
There are regional variations here: Emissions from energy use in the United States and Europe have actually fallen over the past decade.
But, again, Asia is a different story. Nearly half (46.7 percent) of the world's emissions now come from the Asia Pacific region, with 27.1 percent of emissions coming from China alone. And those emissions keep going up and up.
If that continues, the world can expect significant temperature increases and climate change in the decades ahead. The only way to avoid that is to make a fundamental shift away from fossil fuels and toward cleaner sources of energy. And in the last decade, at least, that shift has barely been noticeable on the global level.
Further reading: The BP overview report is here. You can find all the data here. And you can create your own charts here.
CARD 15 OF 24LAUNCH CARDS

How do we reduce greenhouse-gas emissions?

There are a few big ways to reduce greenhouse-gas emissions. We could use less energy (either by becoming more energy-efficient or by conserving). We could switch to cleaner sources of energy. We could also reduce emissions from deforestation and agriculture.
But avoiding a 2°C rise in global temperatures — the ostensible goal of most countries — would require reducing worldwide emissions 40 to 70 percent by mid-century. That's a huge shift. To get things started, the International Energy Agency has argued that such a cut would require $24 trillion in clean energy investments between now and 2020 (and more thereafter). That would include:
  • Each year, on average, 15 power plants and industrial facilities would have to be fitted with technology to capture carbon emissions and store it underground rather than emit it into the atmosphere. (This technology, known as CCS, is still in its infancy.)
  • On average, 32 new nuclear plants and 17,500 wind turbines would need to be built each year to provide carbon-free electricity.
  • The world would need to make its transportation sector much more efficient between now and 2020. That means lighter vehicles, putting 20 million electric cars on the road, and more efficient airplanes. Buildings and factories would also need to become dramatically more efficient at using energy.
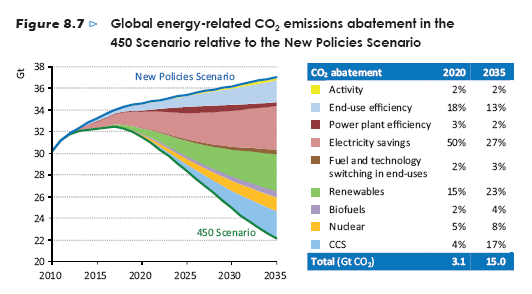
Here's what this looks like in graph form:
Abatement__1_
International Energy Agency
There are ways to tweak this. If countries don't want to deal with nuclear power, then they'd need to ramp up some other clean energy source. If carbon-capture technology doesn't work, then something else will have to supplant it. The basic point is that it's a huge task.
Currently, the International Energy Agency says the world is not currently on track to meet those goals.

Labels: , , ,