Thursday, July 9, 2015

Atlantis

Way down
Under the ocean
 where I want to be
    -Donovan (Atlantis)
Six feet of water
in the streets of Evangenline
     - Randy Newman

Greetings
       When James Hanson says something, its probably worth listening.  Not only has been looking into these maters longer than most, but he is also willing to tell the unvarnished truth  see e.g Ballad of the sad climatoligists.
      So it was with some interest that I listened to an interview he gave in Australia earlier this year, which I found on Ecoshock).  Here is a transcript of part of it
"The paleoclimate evidence indicates the ice sheets are much more sensitive than the glaciologist, the modellers of ice sheets have indicated and furthermore we now have satellite data over the last 12 years that confirms that ice sheet disintegration is a non-linear process that should not have been surprising, and I have been saying that for 10 years, but now this satellite data confirms that.
The ice sheets are losing mass faster and faster with a doubling the of about 10 years. If that continues, we would get sea-level rises of several metres within 40 to 50 years."
Several meters?   40-50 years?
             This is not what I've been hearing from the IPCC, so it was kind of a rude shock.  But it turns out Hanson has been saying stuff like this for some time.  see here
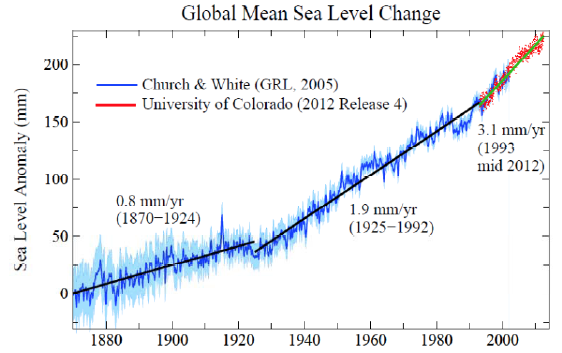
           While the IPCC sees a sea rise in a gentle upslope,  Hanson sees it as accelerating much faster,..

Hansen sea level rise
(Global sea level rise since 1870. Image source: Dr. James Hansen.)
There may be some support for Hanson's view in recent work.  This from Robert Scribbler's blog (see below)
 For a recent study, headed by Shuang Yi and published on April 30 in Geophysical Research Letters provides evidence that, since 2010, annual rates of global sea level rise have shown a strong uptick. The study, entitled An Increase in the Rate of Global Mean Sea Level Rise Since 2010, notes:
The global mean sea level (GMSL) was reported to have dropped 5 mm due to the 2010/11 La Niña and have recovered in one year. With longer observations, it is shown that the GMSL went further up to a total amount of 11.6 mm by the end of 2012, excluding the 3.0 mm/yr background trend. A reconciled sea level budget, based on observations by Argo project, altimeter and gravity satellites, reveals that the true GMSL rise has been masked by ENSO-related fluctuations and its rate has increased since 2010. After extracting the influence of land water storage, it is shown that the GMSL have been rising at a rate of 4.4 ± 0.5 mm/yr for more than three years, due to an increase in the rate of both land ice loss and steric change.
In short, the study finds an average rate of sea level rise of 4.4 mm per year, or 30% faster than the annual rate from 1992 to 2009, during the period of 2010 to 2013."
    Sea level rise is a function  of both thermal expansion dues to increased temperature, and additional water flows dues to melting Glaciers.  Thermal expansion has been the major factor thus far, but by its nature is  generally slow.  Glaciers on the other hand, can melt rapidly. 
       It all comes down to doubling time.  But every exponential curve starts slow and accelerates.  It difficult at the beginning to see which curve the data is following.  It may be a slowly changing curve or a rapidly changing one.    Thus in one paper Hanson argues.
       The increasing Greenland mass loss ... can be fit just as well byexponentially increasing annual mass loss, a behavior that Hansen (2005, 2007) argues could occur because of multiple amplifying feedbacks as an ice sheet begins to disintegrate. A 10-year doubling time would lead to 1 meter sea level rise by 2067 ... 2045 ... for 5-year doubling time and 2055 ... for a 7-year doubling time.

Obviously we are not preparing for such rapid sea rises.   And it could mean a loss of a lot of coastal property.  See Here  One aspect that I hadn't given much though to, however, is the impact on commerce - the impacts on ports.
   Just to get a feel for how much goes through ports, here is what wiki says
American ports are responsible for moving over 99 percent of the country's overseas cargo.
U.S. ports handle a wide variety of goods that are critical to the global economy, including petroleumgrainsteelautomobiles, and containerized goods. Reports from individual ports indicate that approximately 4.6 million automobiles (imports and exports) passed through American ports in 2006.

The impacts of sea level rise to ports could be significant.  For instance one EPA report states.

The U.S. Department of Transportation (U.S. DOT) initiated another effort to examine the risk to transportation infrastructure from climate change along the Atlantic coast. The study is identifying the transportation infrastructure that, without protection, will regularly be inundated by the ocean or is at risk of periodic inundation due to storm surges. Phase 1 of the report, covering Washington D.C., Maryland, North Carolina, and Virginia, was released in December 2007. In the state of Maryland, the study found that 28% of port acreage would be regularly inundated or at risk of periodic inundation if sea levels rose just 6 cm (2.4 inches)

However the Gulf Coast ports are more significant to the national economy. Noaa points out

"Along the Northern Gulf Coast, an estimated 2,400 miles of major roadway and 246 miles of freight rail lines are at risk of permanent flooding within 50 to 100 years as relative sea level is expected to rise in the range of 4 feet (Figure 1). The Gulf Coast is particularly at risk to service disruptions due to a transportation network that is interdependent and relies on minor roads and other low-lying infrastructure. The Gulf Coast is home to seven of the ten largest commercial ports (by tons of traffic) in the country. The region also hosts a significant portion of the U.S. oil and gas industry, with its offshore drilling platforms, refineries, and pipelines. Roughly two-thirds of all U.S. oil imports pass through the Gulf. Sea level rise would potentially affect commercial transportation activity valued in the hundreds of billions of dollars annually through inundation of area roads, railroads, airports, seaports, and pipelines (U.S. Global Change Research Program, 2009). Figure 1 shows the Gulf Coast area roads at risk from sea-level rise.


EPA says
"Looking particularly at the impact of storm surges, the Gulf Coast Study determines the percentage of marine transportation facilities in an area from Mobile, AL to Galveston, TX that would be affected by certain levels of storm surges. The study predicts that relative sea levels in the region will rise between 0.3 and 7 feet, depending on location, over the coming century. Average temperatures in the region are likely to increase between 0.9°F and 4.5°F over the next fifty years.11 The study provides probabilities for some impacts at the regional level. For example, if relative sea levels rise 4 feet, 72 percent of ports in the region will be at least partially inundated.
So, Hanson's conclusion looks pretty accurate.  
"So spell that out for us James before we move on, sea level rises of several meters in forty years, what would that look like in terms of our lives
The consequences are almost unthinkable. It would mean that all coastal cities would become dysfunctional, some parts of the cities would still be sticking above the water but they would not be habitable, so the economic implications are incalculable. We really cannot go down that path, this is an issue of intergenerational injustice.   It’s a moral issue because the current generation is burning the fossil fuel and getting the benefits and creating a situation that for young people, our children and grandchildren and future generations is going to have enormous consequences."


For an interesting interactive map of pontential flooding, see here 


Global Sea Level Rise Going Exponential? New Study Records Big Jump in Ocean Surface Height

From about a thousand years ago through to the mid 19th Century, global sea levels remained remarkably stable. Together with overall global temperatures, sea surface heights stayed at about the same levels until the late 1800s. At that time, an initiation of large-scale burning of oil, gas and coal dumped heavy volumes of greenhouse gasses into the atmosphere. The Earth System began to warm and seas began a slow upward climb.
Hansen sea level rise
(Global sea level rise since 1870. Image source: Dr. James Hansen.)
At first, the pace of sea level rise was minor — only hitting about 0.8 mm per year. But then, by around 1925, the rate of sea level rise more than doubled to 1.9 mm per year. The oceans, which at first only slowly accumulated heat, began a long term warming which eventually extended through almost every depth and region. This pace maintained until about 1992 when the oceans again hit a higher rate of rise at around 3.1 mm per year — a pace that then included a small but ominously growing portion of glacial melt.
Now, it appears that global warming is again pushing sea levels to rise even faster. As, over recent years, a number of ominous indicators pointed toward yet another surge in ocean surface levels.
All over the world’s frozen regions, the great land glaciers — especially in Greenland and Antarctica — have been destabilizing. Melting, cracking, and clamoring as their gargantuan, mountain-like forms assembled in an ever-speeding march to the seas. This great rush of freshwater melt and ice is already causing an ocean-threatening slow-down of Atlantic circulation. And in the Southern Ocean surrounding Antarctica an ominous bulge of water near the southern polar zone became an indicator of an increasing rate of melt from some of the largest glaciers on Earth. A bulge that was 2 centimeters higher than the global average along melting and thawing Antarctic shores.
Global Sea Level Rise On Upward Curve?
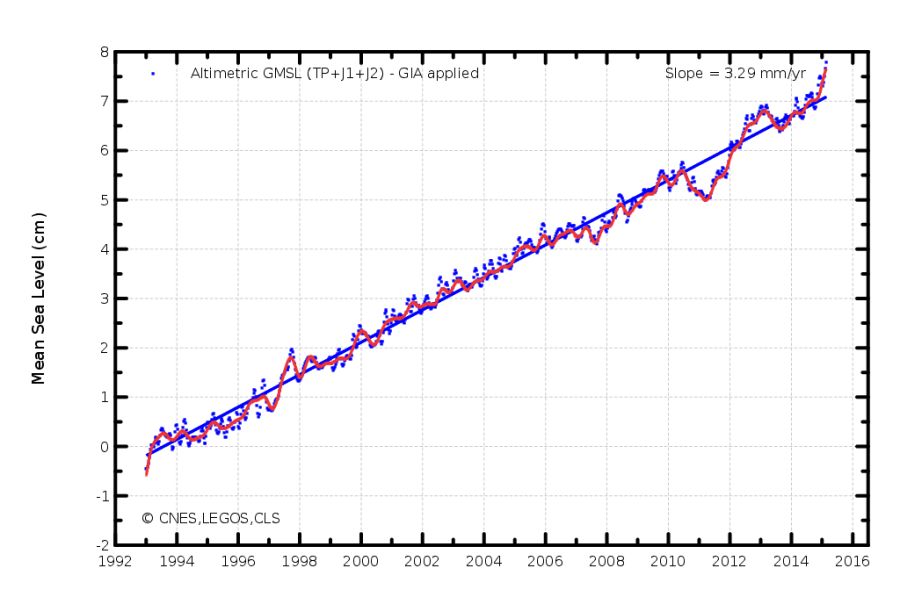
Recently, the global sea level rise measure — AVISO — also took an unsettling leap. With satellite captures of the world ocean showing a strong surge in sea level rise throughout 2014 and into 2015. A spike that displays vividly as a hockey-stick like jog at the tail end of the measure below:
Aviso sea level rise
(Big spike in sea level rise plainly visible in the AVISO measure. Image source: AVISO.)
It’s an upward jump representing nearly a 1 centimeter spike in the rate of sea level rise over the past six months.
By itself, this jump in sea level would be something to worry over. But new findings paint an even starker picture. For a recent study, headed by Shuang Yi and published on April 30 in Geophysical Research Letters provides evidence that, since 2010, annual rates of global sea level rise have shown a strong uptick. The study, entitled An Increase in the Rate of Global Mean Sea Level Rise Since 2010, notes:
The global mean sea level (GMSL) was reported to have dropped 5 mm due to the 2010/11 La Niña and have recovered in one year. With longer observations, it is shown that the GMSL went further up to a total amount of 11.6 mm by the end of 2012, excluding the 3.0 mm/yr background trend. A reconciled sea level budget, based on observations by Argo project, altimeter and gravity satellites, reveals that the true GMSL rise has been masked by ENSO-related fluctuations and its rate has increased since 2010. After extracting the influence of land water storage, it is shown that the GMSL have been rising at a rate of 4.4 ± 0.5 mm/yr for more than three years, due to an increase in the rate of both land ice loss and steric change.
In short, the study finds an average rate of sea level rise of 4.4 mm per year, or 30% faster than the annual rate from 1992 to 2009, during the period of 2010 to 2013. For these, more rapidly rising, sea levels the study identifies clear causes. The first is an increasing rate of land ice loss. The second is what is termed as ‘steric change’ — a scientific phrase that both identifies ocean thermal expansion due to warming combined with changes in ocean salinity, which also impacts sea surface height.
The April 30 study did not include the more recent sea level rise spike now showing up in the AVISO measure. So, at least for now, sea levels do appear to be sliding up some rather dangerous curves.
Hitting the More Difficult Rates of Sea Level Increase
Such a jump has stark implications for sea level by end century. A 4.4 mm per year rate of rise would equal just less than half a meter of increased sea level within one Century. This compares to the previous rate of rise which would have resulted in a 1 foot global jump within a one hundred year span.
A jump of this kind was, however, predicted with sea level rise by end of this Centuryexpected to hit between 0.5 and 1 meters of increase in the IPCC measure and between 5 and 6 feet in US Coast Guard studies (most studies find a range between 3-9 feet for this Century). The 4.4 mm per year increase is rather ominous in that it already puts annual rates of rise in the IPCC mid-range. An early ramp up with fully eight and a half decades left to go in a Century that will certainly see substantial further increases in global heat accumulation.
Composite
(South Florida 6 meters of sea level rise before [left frame] and after [right frame]. Note that second image is an artist’s rendering based on flood analysis showing what a 6 meter sea level rise would look like for South Florida, should it occur. Image source: Tropical Audobon Society.)
Many planners use the IPCC measure or even more conservative indicators to prepare for sea level rise at their city, county and state shores. And the fact is these indicators may fall well short of reality at the coastlines. A stark circumstance that will become more and more difficult to manage as time moves forward.
Overall, a 2010 ramping in the rate of sea level rise is a bit soon. Similar further jumps leading up to potential worst case 1-4 cm per year levels would initiate a combination of dangerous impacts including untenable rates of rise for coastal regions, severe shocks to ocean circulation systems and overall ocean health, and potentially very dangerous impacts to the world’s weather. To this point Hansen’s paper entitled ‘Greenland Ice Sheet Mass Loss, Exponential?‘ is well worth a (re)read.
Similar Climate Conditions Saw 20 Meter Surges in Sea Level Due to Glacial Melt
With current greenhouse gas levels now in the range of 400-405 parts per million coinciding with substantial jumps in glacial melt and sea level rise, it may be worth taking a look back at times in the geological past when atmospheric heating conditions were similar to those seen today. The last time heat trapping gasses were seen at such high concentrations was at the height of the Pliocene warming 3-5 million years ago. That time saw temperatures in the range of 2-3 degrees Celsius warmer than Holocene averages. It was also a geological period that saw Antarctic and Greenland melt events that pushed seas up to 20 meters higher.
We are exceeding maximum Pliocene atmospheric CO2 thresholds at this time (well exceeding if you count in a 485 CO2 equivalent forcing from all greenhouse gasses added by human beings). And we will almost certainly enter Pliocene warming levels this century. So the melt pressure we are putting on the world’s ice sheets is likely to at least be in the 20 meter range for the (hopefully) longer term.

Labels: , , , , ,

0 Comments:

Post a Comment

Subscribe to Post Comments [Atom]

<< Home