Thursday, August 29, 2019

I wish I had a river I could skate away on


Little darling, I feel that ice is slowly melting
Little darling, it seems like years since it's been clear
   - The Beatles, 

Meltdown expected, the wheat is growin' thin
Engines stop running, but I have no fear
'Cause London is drowning, and I, I live by the river
   -The Clash


Dates to remember


September 20-27  Climate Strike


Greetings


It was about 100 degrees here yesterday. 


 So, maybe its a good to think about ice.   The melting ice in Greenland is getting a lot of attention, with good reason

Glaciers just aren't acting the way they should. see here  and here


Now, however, a team of researchers has figured out how to directly probe these melt processes and has tested the method out on one glacier in Alaska. What it found, published this week in Science, is worrying: the glacier is melting far faster than current theories had suggested “The melt rates that we measured were about 10 to 100 times larger than what theory predicted,” says lead study author David A. Sutherland, an oceanographer at the University of Ore


But it's not just the arctic .  In fact, Antarctica is also melting rapidly.

GRADUAL ANTARCTIC SEA ICE INCREASES [HAVE BEEN] FOLLOWED BY DECREASES AT RATES FAR EXCEEDING THE RATES SEEN IN THE ARCTIC

“A newly completed 40-y record of satellite observations is used to quantify changes in Antarctic sea ice coverage since the late 1970s. Sea ice spreads over vast areas and has major impacts on the rest of the climate system, reflecting solar radiation and restricting ocean/atmosphere exchanges. The satellite record reveals that a gradual, decades-long overall increase in Antarctic sea ice extents reversed in 2014, with subsequent rates of decrease in 2014–2017 far exceeding the more widely publicized decay rates experienced in the Arctic. The rapid decreases reduced the Antarctic sea ice extents to their lowest values in the 40-y record, both on a yearly average basis (record low in 2017) and on a monthly basis (record low in February 2017).”

Of course one effect of ice melting is sea level rise.   

Here's a recent presentation on sea-level rise, by John Englander

He makes the point that the melting of the glaciers is now unstoppable.  There is so much heat in the ocean and the air that it is just a matter of time before all melts and the sea rises 120 meters.  We just don't know when. 
 Portland has an elevation of 50 feet, less than 20 meters, Salem is 154 around 30 meters. 

He says he expects around 1 meter by 2050. But who knows?  It moves by fits and starts, slow for a while fast for a while. 
    
And here's a nice summary from Counterpunch

Englander’s key points:
1. Sea level never rises smoothly. It’s not a straight line or a curved line. There are inflection points when it suddenly rises. So far, that has not been experienced. In fact, over the past 100 years, temps are up 1°C and sea-level rise is only up 4 inches.
2. Sea level has been stable, at current levels, throughout human recorded history for 5,000+ years.
3. Thus, it’s very difficult for people to imagine a change in sea level, especially after 5,000 years of rock-solid stability.
Today’s big problem: Sea levels are now (today) at an early stage of exponential growth, meaning, the rate of growth is doubling, cycle-by-cycle, for the first time in known history. Based upon satellite recordings since 1993: sea-level rise 1993-98 +1.5MM/yr. 1998-2011 +3.2MM/yr. 2011-2018 5.0MM/yr. That’s nearly double every cycle, which is an exponential function, and it’s trouble, very-very big trouble.
Exponential.   As Professor Al Bartlett has said
The greatest shortcoming of the human race is our inability to understand the exponential function."
So, suppose sea level rise were to double every ten years.  So 5 MM in 2020.  10 MM in 2030. etc   By 2080 its 3 meters. 2100 its 12 meters. Portland goes under in 2110, when it hits 24 M


Melting floating ice doesn't affect sea level, but does increase the amount of blue water.  A new study from Scripps tells us the likely impact

Losing the reflective power of Arctic sea ice will lead to warming equivalent to one trillion tons of CO2 and advance the 2ºC threshold by 25 years. Any rational policy would make preventing this a top climate priority for world leaders,” said Ramanathan, a professor of atmospheric and climate sciences at Scripps.

 2 degrees 25 years sooner than currently predicted?  Hmmm...  

This means that after the blue ocean event, temperatures rise quickly.   A recent study has linked sea ice melting to abrupt climate change such as a spike in temperature .

..from this they determined that sea ice changes were massively significant in past climate change events in the North Atlantic. These periods, called Dansgaard-Oeschger events2, are some of the fastest and largest abrupt climate changes ever recorded. During some of these events, Greenland temperatures are likely to have increased by 16 degrees Celsius in less than a decade.

 Here's one scenario that incorporates a blue ocean event.  see here (PDF)

  2030–2050: Emissions peak in 2030, and start to fall consistent with an 80 percent reduction in fossil-fuel energy intensity by 2100 compared to 2010 energy intensity. This leads to warming of 2.4°C by 2050, consistent with the Xu and Ramanathan “baseline-fast” scenario. However, another 0.6°C of warming occurs  taking the total to 3°C by 2050 — due to the activation of a number of carbon-cycle feedbacks and higher levels of ice albedo and cloud feedbacks than current models assume. [It should be noted that this is far from an extreme scenario: the low-probability, high-impact warming (five percent probability) can exceed 3.5–4°C by 2050 in the Xu and Ramanathan scheme.]   

You can track air  temperature  rising here.   As you can see the same issue of exponential curve arises here.

According to this smoothed estimate, the trend — which is where we look for climate change (man-made or not) — has shown two episodes of warming since the year 1900. The first, from about 1910 to 1945, it rose roughly 0.43°C, while from about 1975 to now it has risen around 0.84°C. That’s basically twice as much.

So, when will we see a blue ocean event ?  

Current models say between 2030 and 3050,  closer to  2030 being more likely


So, whats the plan?


Dave Roberts put out a nice post explaining that what it will take is not evolutionary but revolutionary.  No pain no gain.  He says

"The facts of climate change mean that there is no such thing as a 'moderate' position on it. You do the radical things necessary to meet IPCC targets or you sit back & let radical impacts unfold."

"Most Americans say they want the U.S. to take “aggressive” action to stop climate change, yet only a minority would put up with even small increases in their taxes or electricity bills to do so.

Bernie's Green New Deal.?  $ 16 trillion

Hmmm......


So, its probably going to get hotter

 For a view into our future see  "Can we survive extreme heat?" . here.  " It starts with a blackout "  


“Hurricane Katrina caused a cascading failure of urban infrastructure in New Orleans that no one really predicted,” Chester explains. “Levees broke. People were stranded. Rescue operations failed. Extreme heat could lead to a similar cascading failure in Phoenix, exposing vulnerabilities and weaknesses in the region’s infrastructure that are difficult to foresee.”
In Chester’s view, a Phoenix heat catastrophe begins with a blackout. It could be triggered any number of ways. During periods of extreme heat, power demand surges, straining the system. Inevitably, something will fail. A wildfire will knock out a power line. A substation will blow. A hacker might crash the grid. In 2011, a utility worker doing routine maintenance near Yuma knocked out a 500-kilovolt power line that shut off power to millions of people for up to 12 hours, including virtually the entire city of San Diego, causing economic losses of $100 million. A major blackout in Phoenix could easily cost much more, says Chester.
But it’s not just about money. When the city goes dark, the order and convenience of modern life begin to fray. Without air conditioning, temperatures in homes and office buildings soar. (Ironically, new, energy-efficient buildings are tightly sealed, making them dangerous heat traps.) Traffic signals go out. Highways gridlock with people fleeing the city. Without power, gas pumps don’t work, leaving vehicles stranded with empty tanks. Water pipes crack from the heat, and water pumps fail, leaving people scrounging for fresh water. Hospitals overflow with people suffering from heat exhaustion and heatstroke. If there are wildfires, the air will become hazy and difficult to breathe. If a blackout during extreme heat continues for long, rioting, looting, and arson could begin.


Labels: , , , , ,

Friday, August 22, 2014

Greenland and Antarctic maps reveal “unprecedented” ice loss


Cold as ice
Someday you'll pay the price
    - Foreigner

I have lived here before, the days of ice,
And of course this is why I'm so concerned,
And I come back to find the stars misplaced
and the smell of a world that has burned.

      -Jim Hendrix

Greetings

      Interesting goings on up in Greenland.  Ice is  melting.   (see below from Carbon Brief) This, of course is somewhat concerning, as it will "eventually" result in a problematic sea rise.

    As usual with climate science, this recent melting is proceeding "faster than anticipated".  And it seems to be accelerating.  As reported by Robert Scribbler

   "It was an extraordinary rate of melt now 4.7 times faster than in the period from 1997 to 2003 and 2.5 times faster than during 2003 to 2009. But, likely, it is but one more milestone on the path to even faster melt."
    
     What does this mean?


   Perhaps its useful to look at at the geologic record .  Here's a summary from a new report from David Spratt, author of Climate Code Red

  • "During mid-Miocene climatic optimum  [16-14 million years ago] CO2 levels were similar to today, but temperatures were ~3–6C warmer and sea levels 25 to 40 metres higher than at present… When CO2 levels were last similar to modern values (greater than 350 ppmv to 400 pmv), there was little glacial ice on land, or sea ice in the Arctic, and a marine-based ice mass on Antarctica was not viable… Lower levels were necessary for the growth of large ice mass on West Antarctica (~250 to 300 ppmv) and Greenland (~220 to 260 ppmv)" (Tripati, Roberts et al., 2009).
  • “We estimate sea level for the Middle Pliocene epoch [3.0–3.5 million years ago] – a period with near-modern CO2 levels – at 25±5 metres above present, which is validated by independent sea-level data” (Rohling, Grant et al., 2009).
  • Likewise, “during the middle-Pliocene … we find sea level fluctuations of 20-40 metres associated with global temperature variations between today’s temperature and +3°C” (Hansen, Sato et al., 2013).

 
   But of course, humans,  being creatures with hyperbolic discount rate, we aren't that concerned about events that might happen at the end of the century, but do worry about things in our lifetime.   Our first question is ; When?

     It seems the future is coming at us at an accelerating rate.   Back to Robert:

"It is likely that mass rate losses will continue to increase until some kind of break or negative feedback comes into play. Similar rates of melt increase would mean an annual 5-8 millimeter sea level rise by 2035 due to Greenland and Antarctic melt on top of a 2-3 millimeter sea level rise from thermal expansion of the oceans and from other melt sources. But even taking into account the cooling effect at the ocean surface from ice melt and fresh water floods, one could easily envision the feared 1-3 foot sea level rise by sometime near mid century and the even more concerning 3-9 foot sea level rise amidst a very intense battle between hot and cold weather systems through to century’s end."


Fun facts about sea level rise from here:

• Thirteen of the world’s 20 largest cities are now located on a coast.
• Nearly 25% of the world’s population lives within 62 miles (100 kilometers) of a shoreline, and this figure is likely to increase to 50% over the next 25 years as people flock to coastal cities.
• More than 600 million people live in coastal regions that are less than 10 meters above sea level.
• Two-thirds of the world’s cities have populations of five million or more living in at-risk areas that are less than 10 meter above sea level. (Source)
• Thirteen of the world’s fifteen largest cities are on coastal plains. Many smaller cities, such as Alexandria, Egypt’s ancient center of learning, also face a severe risk of inundation with a 39-inch (1m) rise in sea level. 
• Low-lying coastal regions in developing countries such as Bangladesh, Vietnam, India, and China have especially large populations living in at-risk coastal areas such as deltas, where river systems enter the ocean. Both large island nations such as the Philippines and Indonesia and small ones such as Tuvalu and Vanuatu are at severe risk because they do not have enough land at higher elevations to support displaced coastal populations.
• Some island nations risk the danger of losing their fresh-water supplies as sea level rise pushes saltwater into their aquifers. For these reasons, those living on several small island nations (including the Maldives in the Indian Ocean and the Marshall Islands in the Pacific) could be forced to evacuate over the 21st century. (Source)
• With sea level projected to rise at an accelerated rate for at least several centuries, very large numbers of people in vulnerable locations are going to be forced to relocate. If relocation is delayed or populations do not evacuate during times when the areas are inundated by storm surges, very large numbers of environmental refugees are likely to result. (Source)

For visual representation of such a rise see here.    

-------

Greenland and Antarctic maps reveal “unprecedented” ice loss


A series of maps published this week show Greenland and Antarctica are losing more ice than at any time since satellite records began.
Scientists found the two vast ice sheets are losing a total of 500 cubic kilometers of ice per year, contributing to rising global sea levels.
Ice loss
The researchers used data from the European Space Agency's CryoSat - a satellite that passes over the earth at 700 kilometers above the surface and measures the thickness of polar ice.
The satellite was launched in 2010 and has been collecting data on sea ice and ice sheets ever since. By comparing data with other satellite missions, scientists can see how quickly the ice sheets are changing.
The study, just published in the journal The Cryosphere, reveals that since 2009, the volume of ice loss has tripled in West Antarctica and more than doubled in Greenland. This is the highest rate of ice loss since satellite records began 20 years ago.
Regional differences
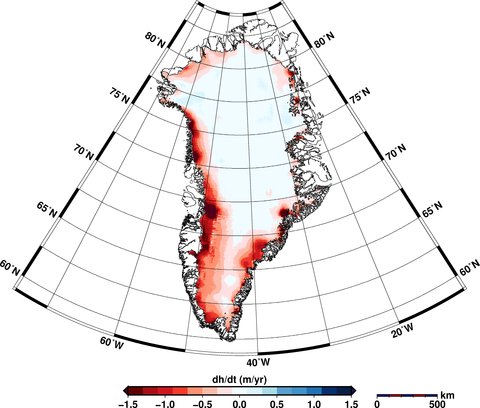
The maps show that Greenland is losing around three times more ice than Antarctica, including thinning of the entire western ice sheet and further losses in the southeast and northwest ice sheets. You can see where the greatest losses of ice are occurring in the red areas in the maps below.
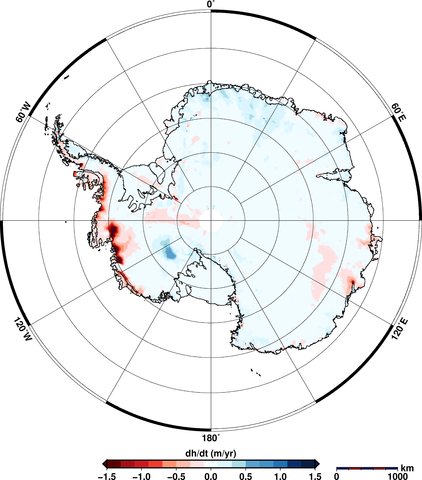
In Antarctica, the maps show thinning of the West Antarctic Ice Sheet and the Peninsula. East Antarctica shows some increases in thickness (shown in blue in the maps), though this doesn't outweigh the losses elsewhere. Overall, more ice is being lost than gained.
The Cryosphere _Greenland Elevation Change _Aug 14

The Cryosphere _Antarctic Elevation Change _Aug 14
Elevation changes in Greenland (top) and Antarctica (bottom) between January 2011 to January 2014. Areas in red show loss of ice; blue shows gains. Source: V. Helm et al.(2014)
Satellite measurements
CryoSat collects data at 200 million points in Antarctica and 14.3 million in Greenland, as aBBC article today notes. Satellites can measure ice sheet heights by firing a radar pulse at each point and recording the time it takes for the signal to bounce back.
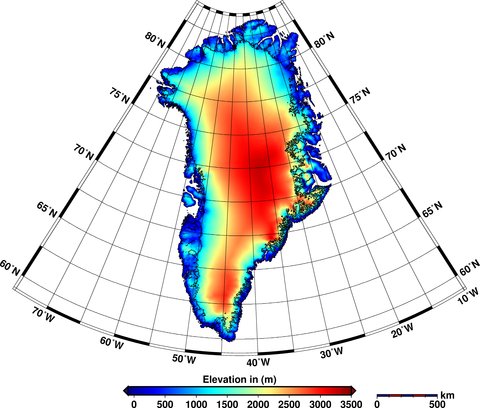
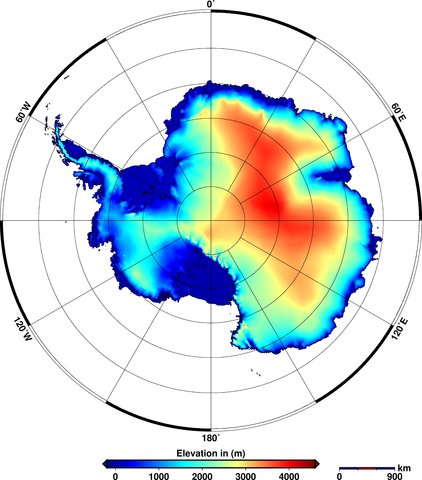
The data is used to create digital elevation models that provide a 'snapshot' of the state of the ice sheets covering the two land masses. You can see how the ice thickness varies over the surface of the earth in the figures below. The areas in red show thicker ice towards the middle of the land mass and the blue areas show the thinner ice around the edges.
The Cryosphere _Greenland Elevation _Aug 14

The Cryosphere _Antarctic Elevation _Aug 14
Elevations of ice in Greenland (top) and Antarctica (bottom) in 2012. Red shows areas of thicker ice; blue shows thinner ice. Source: V. Helm et al. (2014)
New imagery
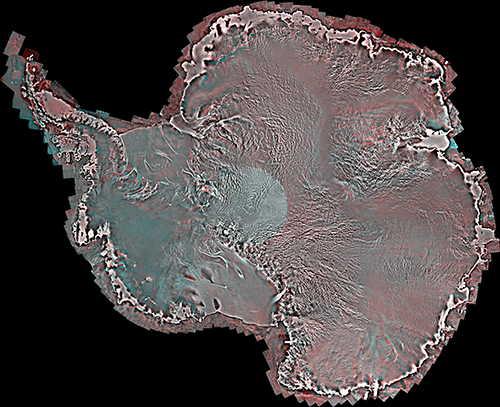
These aren't the only new satellite images to be released this week. A Canadian collaboration, including the University of Waterloo and the Canadian Space Agency, released a satellite 'mosaic' image of the whole of Antarctica.
The image, shown below, is made up from over 3,000 satellite images taken in 2008.
Uni Of Waterloo _Antarctica Image _Aug 14
Mosaic satellite image of Antarctica. Source: University of Waterloo
Yesterday's Mail Online covered the new research, featuring some of the satellite's images - such as the one above - including a close-up of an individual ice shelf.
The team behind the image also produced an equivalent version from images taken in 1997 and hope that being able to compare the two could help scientists identify changes in the ice sheets over Antarctica.
The next steps for the team include providing more regular updates to the Antarctic image, and creating a similar mosaic image for Greenland.

V. Helm, A. Humbert, and H. Miller (2014) Elevation and elevation change of Greenland and Antarctica derived from CryoSat-2, The Cryosphere, doi:10.5194/tc-8-1539-2014

Labels: , , , , , ,