Tuesday, April 30, 2013

Peak Oil is so last year


Greetings


           The "peak oil is dead "meme, is growing like wildfire.  There is a big article in the Atlantic, provocatively entitled "What if we never run out of oil?"     The article is mainly about methane hydrates, and how recent Japanese efforts to harvest them mark the beginning of a new era..  Kurt Cobb does an excellent job of dealing with that claim, as well as other  "high stock , but low flow" resources - like tar sands,  deep water oil and  Arctic oil,  in his piece. The only true metric of energy abundance: the rate of flow

Withe respect to tight oil and gas, he notes:

"Charles Mann, the author of the piece, has missed the two most crucial points about the future supply of oil and natural gas. First, new unconventional sources of these hydrocarbons are more difficult and costly to extract than conventional ones. In addition, the unconventional well flows exhibit very steep declines in their rate of production--so steep that in the tight oil fields of Texas and North Dakota drillers must replace about 40 percent of their production PER YEAR just to maintain current output. The decline rates for shale gas are no more encouraging: 79 to 95 percent after three years according to a comprehensive survey of 65,000 oil and gas wells in 31 shale plays. Shale natural gas and tight oil drillers face a task similar to climbing up a down escalator. Each must replace enormous fractions of their current production frequently just to keep production flat. A path to persistently rising global production of oil and gas far into the future cannot be built on production from such fields.


. .  Then  I  saw a piece in the New York Times Sunday, dealing with the perils of  US energy Independence  !  Amazing stuff.    The author accepts, without analysis   the premise that the US will 

    "..overtake Saudi Arabia as the world's largest oil producer as early as 2017, start exporting more oil and gas than it exports by 2025, and achieve full energy self-sufficiency by 2030....oil could fall to just $50 a barrel within the next two years."    (Interestingly the net version of this story omits some of these claims) 

            
To which I can only reply :  "GIGO!"
But Chris Nelder offers a more serious response, in an interview in in the Washington Post, noting in part :

In 2005, we reached 73 million barrels per day. Then, to increase production beyond that, the world had to double spending on oil production. In 2012, we’re now spending $600 billion. The price of oil has tripled. And yet, for all that additional expenditure, we’ve only raised production 3 percent to 75 million barrels per day [since 2005].


.......
 Mature OPEC fields are now declining at 5 to 6 percent per year, and non-OPEC fields are declining at 8 to 9 percent per year. Unconventional oil can’t compensate for that decline rate for very long.

......

And we’re replacing it with tight oil wells in the U.S. that decline 40 percent in the first year, where the production cost is over $70 per barrel. Or deepwater wells, which deplete at 20 percent per year. Or tar sands, which is expensive. Anticipated production growth for tar sands has consistently failed to meet expectations, year after year after year. Ten years ago, tar sands production today was expected to be twice what it actually is.

These are just low-quality oil resources, and we’re relying on them to compensate for the decline in cheap, high-quality stuff.
But, let's face it, peak oil isn't the issue.  The issue is the price of oil.  If peak oil had no effect on price, who would care? 

      But we do care about price.  Over the past 10 years the price of oil has doubled twice.  In the last 5 years oil usage in the US has dropped by 5%.  Mainly because (some of us)  can't afford the price.  That's peak affordable oil.

   Here's an interview with Steve Kopits of Douglas Westwood.   He has an interesting interpretation of what has happened since 2000, and what is likely in the future   

  A round 2000., it became clear that supply was not growing as fast as demand, and the price rose.  A rising price justified further investment by the oil companies into more and more expensive alternatives - deep oil, tar sands etc.   It was all good.   But then the price stopped rising.   Consumers rebelled.  Kopits notes: 


 "But since 2011, depending on rapidly rising oil prices is no longer a viable strategy. The global economy has said, “this is how much we’ll pay and no more.” At the same time, geology just kept marching along right down the back half of Hubbert’s peak, and costs have continued to rise   

The price  stopped rising because people and businesses couldn't pay it.  It's called "demand destruction"   Kopits calls the number that triggers demand destruction, a country's "carrying capacity" .  When the price goes above that-  people just drop out of the market.  Oil use drops.    That number is lower in the US than it is in China, so the US uses less, while use in China continues to grow.  Until the price hits  China's  carrying capacity".
   

"To begin with, we refer to the price a nation’s oil consumers are willing to pay as its “carrying capacity.” For the US, carrying capacity is about $95-100 Brent [per-barrel oil price in London]. If the oil price is above this level, oil consumption will decline—which is exactly what we see and what we predicted four years ago. ..... For China, by the way, we estimate the carrying capacity at around $115-120 / barrel Brent. So oil consumption will increase in China at $115 Brent, but fall in the advanced economies—exactly the pattern we’ve seen in the last few years.


Here's the interesting part.  The price stopped rising, but costs did not.  The cost of producing the marginal barrel continues to climb.  But,   how will the oil companies recover their costs, if the consumer  can't afford it?   Will the oil company continue to invest in this high cost oil?  Evidently not.

"Well, if you look at their capex plans then you see that Shell, BP, Total, Exxon and Hess are all cutting their upstream spend in their 2013-2017 plans going forward. Only Chevron is raising theirs, and only modestly. So in a world where we are struggling to increase global oil supply and the price itself remains high, the major oil companies are in fact beginning to carve back on their exploration and production investments. It’s capex compression."

...
"The growing hit-list here includes Australia’s Browse, a $45 billion LNG project that was just cancelled. It includes the Arctic, specifically Alaska, where Shell is sitting out the coming season, in part because they ran their drilling rig aground. But Statoil has said they won’t proceed in Alaska until Shell has shown some progress. ConocoPhillips has just cancelled a jack-up rig order that was intended for the Alaskan market. Total pulled out of Canadian oil sands at a loss. Then we see just last week that BP pulled the plug on Mad Dog Phase 2, which would have been one of the major developments in the Gulf of Mexico—a $10 billion megaproject—and that cancellation was a surprise.
What we’re seeing is that the majors are looking at these high-cost projects, and they are beginning to take a more critical eye. This is very much in line with what our model says, which is that oil prices can’t rise much faster than GDP and inflation, plus or minus. And in fact geological costs, as you come down the back side of Hubbert’s peak, will increase and will do so at an accelerating rate. I think we are beginning to see that process now.

So how's it play out in future?

"If you take the plain vanilla interpretation of this, unless the shales start picking up rapidly from non-exploited plays—not the Permian and the Eagle Ford and the Bakken, but places like the Utica and Monterey, where results have been disappointing, or some other plays or even abroad—you are looking at a world in which the marginal consumer is beginning to reject the marginal barrel. And if you run this out for a period of time, you will peak out the oil supply. I think the peak occurs in a finite time frame—not 2030, not 2020. Maybe 2014 or 2016—I’m not exactly sure, but sometime pretty soon, unless shale oil really takes off in new plays.

...
"..we’re going to peak out production not because we’re “running out of oil,” but because the marginal consumer is not willing to pay for the marginal barrel. We seem to be pretty much at that level today.


------

Commentary: Interview with Steve Kopits

by Steve Andrews, originally published by ASPO-USA  | TODAY
Q: You’re dialed in right now on the issue of compression of capital expenditures—or capex compression—in the oil industry. Can you give us a quick definition of what that is?
Kopits: Capex compression is a term we use to describe the reduction of upstream spending by the oil companies when their exploration and production costs are rising faster than their oil revenues. That’s what’s happening today. Hess is divesting oil producing properties to increase profits; BP has shelved the deepwater Mad Dog Phase 2 project in the Gulf of Mexico. This is occurring because oil prices haven’t been increasing, and costs have. So oil companies are looking at their portfolio of projects and deciding to postpone or cancel some of them. Were the oil supply rising quickly and oil prices falling, this sort of capital restraint would be normal—the usual boom-bust cycle of the industry. But oil is still in short supply, and very few of the large oil companies have been able to hold oil production over the last few years—even as they were investing massively in oil exploration and production. Now, they are actually reducing investment in upstream projects, even in the face of historically high oil prices and falling production. That’s capex compression.
Q: And here I thought investments in exploration and development were still on their way up. What’s changed?
Kopits: In aggregate, upstream spend is still rising, but at a decreasing pace.
If we look at the issue more broadly though, there are some things happening in the oil business that are beginning to validate views that we, and analysts like Chris SkrebowKopits:ski, have held regarding economic peak oil.
Peak oil does not occur when we run out of oil. Peak oil occurs when the marginal consumer is no longer willing to pay the cost of extracting and processing the marginal barrel of oil. And we can actually calculate what the related numbers are.
Q: How do we do that?
Kopits: To begin with, we refer to the price a nation’s oil consumers are willing to pay as its “carrying capacity.” For the US, carrying capacity is about $95-100 Brent [per-barrel oil price in London]. If the oil price is above this level, oil consumption will decline—which is exactly what we see and what we predicted four years ago. But carrying capacity is not a static number. It changes over time, specifically, with three things: GDP growth, efficiency gains in the use of oil, and dollar inflation. So if GDP goes up, efficiency goes up and the CPI goes up, then the amount that consumers are willing to pay for oil will increase. For China, by the way, we estimate the carrying capacity at around $115-120 / barrel Brent. So oil consumption will increase in China at $115 Brent, but fall in the advanced economies—exactly the pattern we’ve seen in the last few years.
On the supply side, the global oil supply and related costs are determined primarily by two factors: geology and technology. Geology is driving costs by forcing us to frontier areas like ultra deepwater and the Arctic. Technology, on the other hand, is allowing us to access new resources like shale gas and shale / tight oil. So, for any given oil price, depletion will always drive us to more difficult geologies and thus higher costs. Technology, on the other hand, can move us back to easier geologies and lower costs. Hydrofracking of shale oil and gas wells, for example, has done just that.
Also, if you are so inclined, you can add above-ground constraints—Saudi policy or Venezuelan policy or Alaskan tax and royalty rates, for example. But assuming these latter factors are relatively constant, geology and technology will determine supply for any given oil price.
So, to sum all this up: we hit peak production when the marginal consumer is no longer willing to buy the marginal barrel.
Q: I think I’ve read in your work elsewhere that you believe the consumer is already there.
Kopits: The marginal consumer banged into the price of the marginal barrel, on a static basis, somewhere in 2011 at about $110-115 Brent. And then, oil prices essentially stopped rising. Those of us who use supply-constrained forecasting weren’t surprised. It’s entirely consistent with the historical record. But I think many in the oil business still thought, somehow, that oil prices would continue to rise as they had done in the 2000s. After all, the oil supply is widely acknowledged as constrained, even by those who are not necessarily believers in peak oil. So why wouldn’t prices continue to rise if we’re supply short? Well, because there was a price at which the marginal global consumer would rather reduce oil consumption than pay more. And that price is around $110-115 Brent, and from here on in, we should expect that number to rise only with the purchasing power of the marginal consumer.
On the other hand, the cost of extraction development has continued to increase. Last year costs increased somewhere between 10% and 13%, depending on who you talk to. Exxon’s costs rose about 7% in excess of its increase in revenues, which were also falling. And Petrobras’ costs were rising 10% to 13% faster than its revenues. So what we can see is that in the contest between technology and geology, in recent times geology has been winning. Oil has become more expensive to extract.
Q: But when costs increase to a certain level, production should fall; yet we haven’t seen that.
Kopits: In fact, oil production is falling at most the of the oil majors. It was even down at 2% at Petrobras last year. But on a global scale, you’re right. Oil production hasn’t fallen—for three reasons. First, much of what passes for increased “oil” production is actually natural gas production. This includes natural gas liquids from “wet” natural gas wells; LNG [liquefied natural gas] from gas wells; and gas-to-liquids diesel made from natural gas. That’s about half of global oil supply growth in the last six years right there. Check out any investor presentation from the majors. LNG features prominently.
Second, we started throwing massive amounts of upstream spend into this business. Upstream expenditures essentially went from $250 billion around 2005 to about $650 billion this year. In essence, by really jacking up how much money we were putting into the system, we were able to increase production…a little bit. To that we can add some changes in above-ground constraints, primarily in Iraq, which is a very important part of supply growth.
Finally, we made some important technological advances with hydrofracking technology. US tight oil production and Canadian oil sands growth represent just about 100% of net oil supply growth in the last two years.
But leaving these aside, the system hit a wall in 2005—Ken Deffeyes was really spot on with his prediction—and the way we maintained and only slightly grew production after that was essentially by throwing money at it.
This was facilitated by dramatic oil prices jumps, from $25 in 2002 to $112 in 2012. But since 2011, depending on rapidly rising oil prices is no longer a viable strategy. The global economy has said, “this is how much we’ll pay and no more.” At the same time, geology just kept marching along right down the back half of Hubbert’s peak, and costs have continued to rise.
That’s where we are today: price resistance from the consumer and E and P costs that just continue rising. Despite the very high oil price environment, the upstream financial performance at most of the oil majors, including Exxon and Petrobras, has deteriorated. True, Petrobras’ performance is distorted by government interference, but Exxon is arguably the most disciplined investor in the world. But both of them face deteriorating upstream performance for oil.
Q: Given that emerging reality, how are these companies responding?
Kopits: Well, if you look at their capex plans then you see that Shell, BP, Total, Exxon and Hess are all cutting their upstream spend in their 2013-2017 plans going forward. Only Chevron is raising theirs, and only modestly. So in a world where we are struggling to increase global oil supply and the price itself remains high, the major oil companies are in fact beginning to carve back on their exploration and production investments. It’s capex compression.
Q: Why are they going that route?
Kopits: It’s because they’re not getting the bang for their buck. Their megaprojects—ultra deepwater and LNG—are often not able to hold the line on costs. The growing hit-list here includes Australia’s Browse, a $45 billion LNG project that was just cancelled. It includes the Arctic, specifically Alaska, where Shell is sitting out the coming season, in part because they ran their drilling rig aground. But Statoil has said they won’t proceed in Alaska until Shell has shown some progress. ConocoPhillips has just cancelled a jack-up rig order that was intended for the Alaskan market. Total pulled out of Canadian oil sands at a loss. Then we see just last week that BP pulled the plug on Mad Dog Phase 2, which would have been one of the major developments in the Gulf of Mexico—a $10 billion megaproject—and that cancellation was a surprise.
What we’re seeing is that the majors are looking at these high-cost projects, and they are beginning to take a more critical eye. This is very much in line with what our model says, which is that oil prices can’t rise much faster than GDP and inflation, plus or minus. And in fact geological costs, as you come down the back side of Hubbert’s peak, will increase and will do so at an accelerating rate. I think we are beginning to see that process now.
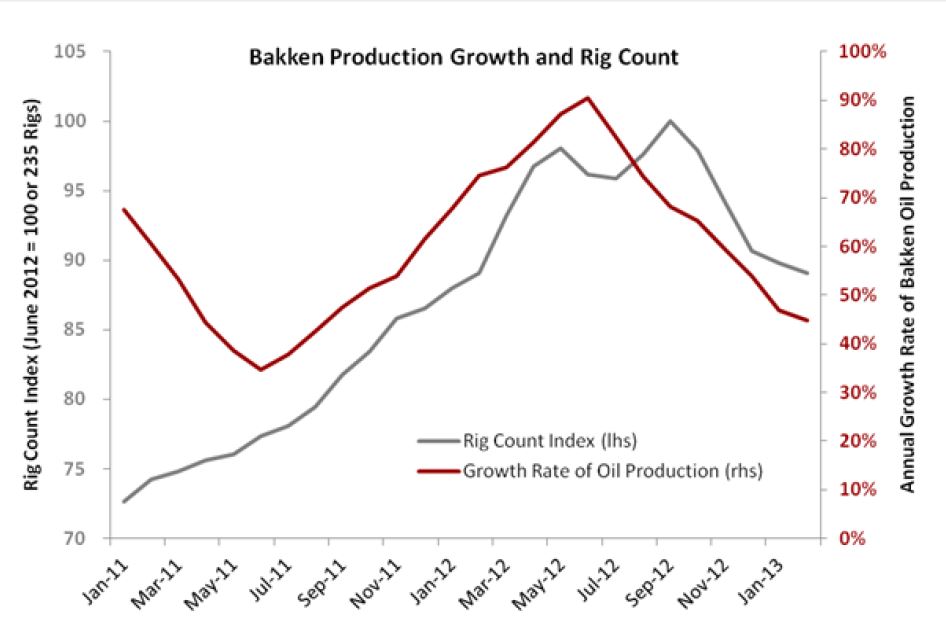
Even when we look at the “good-news” shale / tight oil, some investment is slowing. In the Bakken, for example, the rig count actually peaked in September of 2012, and the year-over-year production growth rate peaked at 90% three months earlier in June. Today the growth rate, while still impressive, is down to about 40%. If that trend continues, we could see single-digit growth in the Bakken much sooner than most think.
Q: So the shale oils won’t be the ever-growing cavalry that everyone expects them to be?
Kopits: If you take the plain vanilla interpretation of this, unless the shales start picking up rapidly from non-exploited plays—not the Permian and the Eagle Ford and the Bakken, but places like the Utica and Monterey, where results have been disappointing, or some other plays or even abroad—you are looking at a world in which the marginal consumer is beginning to reject the marginal barrel. And if you run this out for a period of time, you will peak out the oil supply. I think the peak occurs in a finite time frame—not 2030, not 2020. Maybe 2014 or 2016—I’m not exactly sure, but sometime pretty soon, unless shale oil really takes off in new plays.
Q: So the story line getting a ton of ink of late—peak oil is dead….it isn’t actually quite dead yet?
Kopits: No. But importantly, we’re going to peak out production not because we’re “running out of oil,” but because the marginal consumer is not willing to pay for the marginal barrel. We seem to be pretty much at that level today.
We need to understand these dynamics better. What are the combined effects of flat oil prices and rising production costs, that’s where I think the challenge is and where our professional work is focusing on the macro side…to better understand what these trends are, what they mean, and how companies in the industry should respond to it.
I’ll give you an example. Normally, if you look at an oil production system, it tends to be symmetrical around the peak. The rate at which you approach the peak is the rate at which you depart from the peak. We haven’t done that. What we’ve done is that we’ve approached the peak and we’ve leveled out production, the so-called “undulating plateau”. But we’ve maintained that plateau by turning to non-oil liquids, by dramatic increases in upstream spend, and also by technological innovation related to hydrofracking. All of these, as of today, look to be running their course. Even shale oil. Yes, it will grow for the next few years from the three majors plays in the US, but the peak of production growth is already behind us in the Bakken, for example. On current trends, Bakken production will be increasing by single digits within two years. Not a tragedy by any means, but not enough to move the global oil supply at that time, either.
Of course, we have one more arrow in the quiver after that: government take. Governments typically take 60-90% of revenues of oil production. There’s nothing wrong with that, as in most cases the oil belongs to the respective government. But if the cost of production is increasing, then the value of reserves is falling. Put another way, current levels of government take, whether production or profit sharing, royalties, lease payments or taxes of any sort, are likely unsustainable. Oil companies will need tax relief in one form or another. Far from being able to raise taxes on oil companies, the sober reality is that governments are going to have to get used to getting less. Expect this theme to come front and center in the next couple of years. If government take is reduced quickly, then oil production levels could be sustained for a few more years.
But what then? What’s the outlook for oil production globally? Will production at the high cost producers just ease off gently, or will global production rejoin the anticipated trend line from a 2005 peak sharply and quickly? Will the major oil companies invest just a bit less, or do they start culling their new project list aggressively and without material replacement?
I don’t know what the answer to that is. But that’s what we’re trying to find out. That’s the focus of our macro thinking today.
Steven, thanks for your time and your thoughts.
Steven Kopits has been Managing Director for the New York office of energy business advisors Douglas-Westwood since 2008. He is solely responsible for the views expressed.

Labels: , , , , , , , , ,


Greetings

     Here's the latest from Stuart Saniford.   He starting looking at the trend line for the oil demand in China, the slow growth in oil production, and  then looking at what that means....     Bottom line:

"So, either there's a financial crisis considerably worse than the 2008 one in our future, or we are going to need oil prices considerably higher than we've recently experienced to reconcile supply and demand."


    That's the good news.  Because he is using a very optimistic assumption;  i.e.   no peak before 2025 -  that we stay on the same plateau we've been on since 2005


TUESDAY, APRIL 30, 2013

Oil Supply and Demand to 2025


Yesterday, we took a look at what 7%ish growth in China's oil demand would do if continued to 2025 - adding about another 15 million barrels/day (mb/d) to global oil demand.  Today, let's complete the exercise by looking at the other areas of the world where oil demand is growing rapidly, as well as the trends in supply (all data from BP).  We will see that things don't add up

Firstly, here are the developing regions of the world where oil demand was not squelched by the 2005-2008 oil price shock, or the 2008 financial crisis:


It's easier to see the trends in the individual regions if we show them as separate lines, rather than stacked on top of each other:


Clearly, China is the most important in terms of both level and growth in oil demand, and the Middle East is second.

Now, let's look at the growth rates (in each case, over the decade prior to the year on the x-axis):


In some cases the growth rate has been dropping on the whole (Asia outside of China), while in others it's rising (the Middle East, boosted by high oil prices).  Regardless, in each case we'll use the growth rate for the latest available decade (2001-2011), and calculate the incremental demand that each region would require if that growth rate continued to 2025.  That looks like this:


There's about 30mb/d of incremental demand overall, with China accounting for about half of it.

I stress that this is an extrapolation of the recent trend, not a forecast of what will happen.  In fact, as we'll see, this very likely can't happen.

Let's now look at global oil production.  We'll stick with the annual data from BP, which includes tar sands and natural gas liquids, in addition to crude oil, but not biofuels.  I think that's a reasonable assumption set over this timeframe - NGLs can be used to fill petrochemical demand that would otherwise have to come from oil, and I don't think biofuels can grow much more without causing intolerable food price increases (indeed that already started to happen).

Anyway, here's the data, broken into pre- and post-2005 regions:


As regular readers know, oil production hit a "bumpy plateau" in 2005, and although oil supply has increased since, the increases have been slow and fitful (red line), and only achieved by much higher prices than were required historically.  The green line shows what happens if we assume the existing slope of the plateau continues through 2025.  (Ie, this is not a near-term peak oil scenario at all, we are just assuming that the observed rate of increase of the last seven or eight years continues, and whenever oil peaks it is after 2025).  As you can see, we only get an extra 5mb/d or so this way.  Compare that to the 30mb/d we got by extrapolating the demand of developing regions.

So what's been making up the difference so far?  Primarily falls in oil demand in the developed regions of the world (here taken to be the OECD).  If we look at OECD oil consumption from 1990-2025, we get this:


OECD consumption peaked in 2005 (boundary between the blue and red regions of the data), and in my opinion is never likely to reach that level again.  Even though global peak oil has not occurred, peak OECD demand has likely occurred given the burgeoning demands in the developing world (peak oil is not synchronous).

The two orange lines show possible scenarios for future OECD demand.  The lighter top line shows what happens if we just extrapolate the post 2005 decline.  Note that this post 2005 period has not been a great time in the OECD.  The US faced an oil price shock followed by a bursting housing bubble, and is still experiencing slow growth and elevated unemployment.  Europe is even worse off, with no sign of an end to the recession there, and parts of the periphery experiencing Great Depression levels of economic damage.  Meanwhile, Japan has been stuck in permanent economic doldrums since the nineties.  Yet, if we continue this trajectory out to 2025, we only save about 8mbd.  Add that to the projected 5mbd of new supply, and we've only got 13mbd, not 30mbd.  To get things to balance purely out of OECD conservation, we need to lop off 25mbd of demand by 2025 (the heavier orange line lower down).  That's a drop of more than half in 13 years.

So it should be clear that something has to give here.  Either oil supply has to start growing a lot faster than it has been in the last eight years, or the OECD has to go on a crash conservation program, or developing regions, especially China, have to grow their consumption much more slowly than they did in the last decade (with the oil shock and the financial crisis).  Or some combination of all three.

So, either there's a financial crisis considerably worse than the 2008 one in our future, or we are going to need oil prices considerably higher than we've recently experienced to reconcile supply and demand.

Labels: , , ,

Sunday, April 28, 2013

Ice, Ice, Baby!


Greetings

     Here  is an interesting interview with Prof Peter Wadhams, and expert on sea ice, and a review editor for the IPPC.    He discusses the problems with the current models, and some of limits to the IPCC process.  He discusses the likely end of summer ice, the impact of methane and the likelihood of Southern Europe turning in to a desert in this century! 
 
      He is somewhat critical of government policy offices for their reliance of the models, and apparent ignoring the actual observations.

   Just discovered Nevin's Sea Ice Blog.  Quite Amazing.  Lot's of video Interviews with sea ice scientists.  Really good stuff.

Dr Jennifer Francis's article in Yale 360  linking weird weather with the changes in jet stream, caused by the warming in the Arctic.
    
Her article in Oceanography linking Super Storm Sandy to the Arctic, and the jet stream

Jeff Masters's blog about the jet stream and the odd spring weather - second most extreme March.

Death Spiral Video   Help it go viral

The Dark Snow Project  a crowd funded research project to find out how much does wildfire, and industrial soot contribute to Greenland melting


See also:   Paul Bekwith,s blog:   


UPDATE: NEW NASA SATELLITE IMAGERY


By Paul Beckwith
The Arctic region of our planet acts as a climatic air conditioner, and the air conditioner is conking out. We have a problem Houston.
Over the past few weeks, massive cracks have appeared in the ice that connects the Beaufort Gyre region to Alaska. As a result of last summer’s record sea ice-loss, the winter ‘refreezing’ process went dismally and the surface area and thickness never recovered. The situation is frightening with the beginning of the 2013 melt season only a few weeks away.
Policymakers and governments around the world are still using outdated climate models and are therefore operating under faulty presumptions. The best example of this is their maintaining that the Arctic will retain sea ice until sometime between 2040 and 2070, ignoring the devastating 2012 summer loss of sea ice (roughly 30%!). For the record, they’re wrong - completely wrong! Six to 30 months is a much more likely scenario. Maintaining this naïve assumption will not only go down in history as colossal climatology #FAIL, it’s dangerous as it lulls people into a false sense of security (and atmosphere of non-urgency). It facilitates non-action, plain and simple. And we need action now.

HANG ON FOLKS

What does this mean for the planet? If you’ve followed my previous blogs over the past year, you know that as the sea ice and snow cover declines, strange things start happening to jet streams. Very strange. They slow down, become much wavier and more unpredictable (like Frankenstorm Sandy taking a left instead of right), and are directly responsible for an increase in the frequency, size and severity of extreme weather events (floods, heat waves, droughts, etc.). Climate refugees, global disruption of agriculture, growingly-extreme weather events and phenomena… unless we act soon the future is certainly grim.

As is usual these days, the best and most accurate up-to-date information on the state of Arctic sea ice is obtained from climatology blogs and a wealth of online data sources (if you want to look for it, that is). Uncensored near-real-time data and images of sea ice thickness, concentration, motion, temperature and just about anything else you can measure can be found here and here. For example, here's the movie showing how the sea ice thickness has decreased over the past year. The state of deterioration is clear (and shocking).

So back to those new Arctic icecap cracks developing… everything you need to know can be found here. Even better than the images and the article itself, in my opinion, are the comments from climatologists, scientists and a growing number of very informed amateurs from around the world. These folks are very knowledgeable about Artic sea ice; many of them have followed the disappearing Artic sea ice for years and are clearly a step ahead of most scientists in their field (at least those scientists not following the links above!). It’s these folks who first spotted the cracking and raced to archival satellite imagery (from 2012) to confirm their fears. Turns out those cracks are appearing 51 days earlier than they did last year. That’s a staggering revelation and a game-changer (NOT a good one) as we approach the 2013 melt season.

As I wrote before: Hold on folks… the times they are a-changin’.

Paul Beckwith is a PhD student with the laboratory for paleoclimatology and climatology, department of geography, University of Ottawa.

Labels: , , , ,

Wow


Greetings

From early warning:


The above is an amazing National Geographic documentary, Chasing Ice, about photographer James Balog's quest to take multi-year time lapse photographs of receding glaciers.  It will take 1hr 12min of your life, but will likely profoundly affect you, at least it did me.  Some breathtakingly beautiful images, and an amazing story.  And of course, the always sobering facts of what climate change is doing to ice everywhere.  It's really well done.

Labels: , ,

Thursday, April 25, 2013


Greetings

 Dave Roberts has good article reviewing the latest Anderson Bowls paper.  The paper takes a look at the real world implementation of climate policies. There representative case is shipping.  Both the shippers and the regulatory agency have high goals fir reducing carbon, but when it comes to actions they fall very short.  Their reduction effort turns out to increase emissions.   Increase by 2200% by 2050.    How can this be?    

  Double speak.     They are "reducing" emissions from where they would have been if they were doing nothing.   Sounds good, but accomplishes nothing.

It's a pretty good indicator of how things will go, if we continue with "voluntary" standards.   Without oversight, and sanctions, greenwash will rule.

-----

http://grist.org/climate-energy/the-brutal-logic-of-climate-change-international-shipping-edition/

The brutal logic of climate change, international shipping edition

There is a titanic gulf between what we say ought to be done about climate change and what we are doing. This ineluctable fact has loomed behind national and international policymaking for decades, but it is getting harder and harder to ignore.
Here’s what we say ought to be done: Article 2 of the 1992 United Nations Framework Convention on Climate Change (UNFCCC), to which 194 countries are party (including the United States), commits to “stabilization of [greenhouse gas] concentrations in the atmosphere at a level that would prevent dangerous anthropogenic interference with the climate system.” In 2009, the international community got more specific. The Copenhagen Accord, with whichover 140 countries have engaged (including the United States), representing more than 87 percent of global emissions, says that the countries of the world should “hold the increase in global temperature below 2°C, and take action to meet this objective consistent with science and on the basis of equity.”
What would it mean to hold the increase in global temperature below 2°C? Unfortunately, models do not offer definitive answers to such questions. All they produce are likelihoods. An emissions pathway that yields a high (90 percent-plus) probability of holding temperatures to 2°C is almost certainly beyond our grasp at this point. Achieving even a 50/50 chance at holding to 2°C would require heroic measures — peaking global emissions before 2020 and reducing them rapidly every year thereafter.
To do so “on the basis of equity” means allowing developing nations (Non-Annex 1 countries, in U.N. lingo) a somewhat longer window in which to peak and begin reducing emissions. After all, developed (Annex 1) nations had the luxury of cheap fossil fuels as they developed and are responsible for the bulk of historical emissions.
So let’s take a look at those emission pathways. In the graphic below, the graph on the left shows the pathway that would offer a 60 percent chance of holding temps to 2°C. The one in the middle shows at 50 percent chance. The one on the right shows a 50 percent chance, but with “more equity,” i.e., more time for non-Annex 1 nations to hit the peak. Observe:
Anderson & Bows: 2C emission pathways
Anderson & Bows
Click to embiggen.
This is from the work of climate scientists Kevin Anderson and Alice Bows, which was introduced in a paper called “Beyond ‘dangerous’ climate change: emission scenarios for a new world” [PDF]. I wrote a post about this in late 2011 called “the brutal logic of climate change.”
Needless to say, we are not acting in a fashion that would put us on any of those emission curves. According to International Energy Agency chief economist Fatih Birol, our current trajectory is “perfectly in line with a temperature increase of 6°C, which would have devastating consequences for the planet.”
In a more recent paper, Anderson and Bows try to make this gulf between stated intentions and actions more obvious by focusing on a single economic sector: the international shipping industry.
The industry is an interesting test case. Most global industries face a patchwork of national laws and regulations, but the agency that governs international shipping, the International Maritime Organization (IMO), has argued strongly that the industry should be governed by a single regulatory regime, as though it were a sovereign nation of its own. So this is a case where the international community’s intentions could theoretically be translated directly to action, without national governments as intermediaries. The IMO has said that the industry “will make its fair and proportionate contribution” to international mitigation efforts. (Shipping is responsible for about 3 percent of global emissions.)
The trade association for merchant ship operators, the International Chamber of Shipping (ICS), has said that the industry’s efforts will “be at least as ambitious” as UNFCCC targets.
So here we have an industry that has pledged in strong terms to do what is necessary to hold global temperature rise to 2°C, and a governing regulatory body that has pledged the same. So what’s actually happening?
The IMO’s two big mitigation efforts are Energy Efficiency Design Index (EEDI) and the Ship Energy Efficiency Management Plan (SEEMP). I won’t bore you with the details of those programs; we’ll skip to the part where Anderson and Bows show us how they stack up against the the reductions the industry would need to make if it were serious about 2°C.
In the graphic below, the graph on the left is three scenarios that represent international shipping doing its “fair and proportionate” share to reduce emissions. The graph on the right shows those scenarios compared to the emissions curves charted by the IMO’s policies:
Anderson & Bows: 2C emission pathways for shipping
Anderson & Bows
Click to embiggen.
You don’t have to be a scientist to note that the scenario lines go down and the industry’s lines go up. In fact, note Anderson and Bows, “the shipping industry’s EEDI and SEEMP leave the sector on a trajectory for emissions to be approximately 2200% higher by 2050 than is their fair and proportionate contribution.”
Let that sink in for a moment: 2,200 percent. That’s the size of the gulf between the industry’s stated intentions and the industry’s real-world policies, between what it says it intends to do and what it’s doing. Anderson and Bows call this a “Machiavellian duality,” and it is by no means unique to shipping. It is true of most industries and most countries. We talk a good game about 2°C, but nobody, anywhere, is doing close to what would be necessary to make it real.
To add a kind of surreal twist to all this, the industry talks constantly about the emission “reductions” it plans. How can it do this when, as the graph makes clear, it plans enormous emission increases? What enables this kind of Orwellian doublespeak?
The answer is that the reductions are relative to a baseline projection of growth. They’re lower than they would be otherwise, without policy to reduce emissions. You hear this all the time, from companies, industries, agencies, and countries, about emission “reductions” that are, in fact, merely slightly-less-enormous emission increases. And so we lull ourselves with the thought that we’re doing something, making progress.
To point this out is not to counsel despair. It is merely to state the truth. Incremental policies will not do the job — what’s needed is fundamental changes, policies that halve emissions and then halve them again, over and over, until 2050. (If you’re interested in shipping particularly, Anderson and Bows list some of those step-wise policies at the end of their paper.) What is true for shipping is true for virtually all the world’s industries and countries. They say they want to avoid dangerous climate change. But they are barreling toward it, tweaking their emissions at the margins, hoping that at the end of the day there might be an A for effort. There won’t be.

Labels: , , , , ,

Wednesday, April 24, 2013

3 and 1/2 ways of looking at Climate


Greetings

   
    How likely is it that we humans take the necessary steps to prevent climate change from changing the biosphere?  It may depend on how people look at climate change.  

  It seems to me that we can categorize people into three groups


1 Deniers.     This groups either thinks that the climate isn't warming, or that if it is, it isn't human caused.   Recent polls put this group at about 50% of the US population, well above the number needed to assure that no meaningful action is taken in Congress.  ( take a look at the recent vote on gun control, where despite 90% popular support they couldn't get 60 senators)

2 Optimists.   This is the other 50%.  This group accepts that there is human caused warming and believes that further warming can be controlled without affecting the economy in a substantial way.   They favor things like the "green economy".  They advocate adoption of efficiency measures, and a transition to more renewable energy.     But the implementation is limited by the "prime directive", that in all cases economic growth must be maintained.      In this group are found most liberal politicians.   

see e.g. 
Drawing on this and other thinking it is relatively easy to develop a theoretical plan that would deliver global decarbonisation without impinging on living standards - a plan based on a ban on the use of unabated coal power, a massive increase in clean tech R&D, demanding new energy efficiency and green product standards, the global deployment of smart grid technologies, huge investment in climate adaptation, the phasing out of fossil fuel subsidies, the introduction of appropriate carbon pricing mechanisms, and a global effort to explore the feasibility of geo-engineering proposals

    Unfortunately I am skeptical that the measures offered can avoid dangerous climate change, e.g. 2 degrees.   (and maintain growth)  I also, doubt it will stop change short of the tipping points, past which climate change will  achieve a " self reinforcing" status.  So these measures will probably not affect the end result.  ( I have more confidence in a de-growth policy)   I suppose there may be some argument that such measures could slow the onset of the inevitable, though. 

2a   Strategic Optimists    Many climate policy makers agree with my assessment that this approach will not succeed , that it is too little too late.  Nevertheless they  espouse this view, and put out papers that justify it,  in an effort to bring the public along  To see some of the slight of hand  in climate policy papers,  see  Kevin Anderson's presentation:  Real Clothes for the emperor.     
  '
       Although    I can certainly understand the appeal of such a strategy,   I am not sure that this approach has any benefit.   I'm not convinced that that people are able to accept  the nature of or current situation, and the measures needed to deal with it.    For an interesting analysis of why people are unable to move to a more realistic assessment, see  John Michael Greer's series, on what he call our "civil religion",  the faith that all problems will be resolved through a combination of technology and markets, resulting in a continuous march of progress.  


3.  Realists.   This group is tiny, as is unlikely to grow given our "civil religion" (Greer) ; or  our genetic disposition (Reese).    This group accepts that dangerous climate change probably cannot be averted  without "significant" measures,  which would have serious economic and life style effects.  This group is rather small, and, in my view, not likely to grow   I would put in this category people like Kevin Anderson  (video), of the Tyndall Centre, George Monbiot, author of Hell and High Water, and columnist for the Guardian.  As, Monbiot says:
Unsurprisingly, hardly anyone wants to talk about this, as the only meaningful response is a reduction in the volume of stuff we consume. And this is where even the most progressive governments' climate policies collide with everything else they represent. As Mustapha Mond points out in Brave New World, "industrial civilisation is only possible when there's no self-denial. Self-indulgence up to the very limits imposed by hygiene and economics. Otherwise the wheels stop turning".
The wheels of the current economic system – which depends on perpetual growth for its survival – certainly. The impossibility of sustaining this system of endless, pointless consumption without the continued erosion of the living planet and the future prospects of humankind, is the conversation we will not have."
 Probably  professor William Reese, inventor of the ecological footprint, who has called for a voluntary recession,   see here, where he says:
"I suggest that the failure of the sustainability project to date has much to do with the modern world’s failure to face up to basic facts of human nature. My working hypothesis is that because of certain evolutionary traits, many associated with K selection, modern H. sapiens is biased against sustainability. Moreover, humanity’s technological prowess and society’s addiction to continuous material growth reinforce the biological drivers, making the problem particularly intractable. More specifically, I hypothesize that unsustainability is an inevitable emergent property of the systemic interaction between contemporary technoindustrial society and the ecosphere. Both genetic and sociocultural factors contribute to the conundrum (Rees, 2009b)

      If this analysis is correct, what follows?    

1.  It will be very difficult to convince the people of the  US to take the necessary action to reduce CO2.   Its not impossible, but very unlikely. 

2.  At some point in the near future, the "window of opportunity" closes on keeping temperatures below a dangerous level, or perhaps on crossing the tipping point threshold.   Each year of non action , raises the cost of action in a future year.  Thus a CO 2 ramp down, started this year, would only require a reduction of 5% per year.   While if we wait to 2025, it would require 100% .     I'd say  the window effectively closes around 2020.   (Although, given my view of the people's inability to address the problem,   It is probably closed already )

3 At some  not to distant time, it will be too late for mitigation efforts to have any significant effect.   Adaptation will be all that is left.   At what point does it make more sense to focus on more immediate problems, e.g.  food - see e.g:  When Agriculture Stops Working- Growing Food in the Age of Climate Destabilization;      If Climate Change and Population Growth Are Going to Push Food Price up by 50%, What Happens When you Add Peak Oil?;    

Labels: , , ,