Limits Update
Nothing can stop me now
Cause I'm the Duke of Earl
Gene Chandler
No way to slow down
Jethro Tull
Greetings
Well the headlines don't paint a very nice picture. Extinction rate 1000 times normal (Earlier estimate "only" 100 times) Central American drought leaves 2.8 mill hungry ; Flooding in Kashmir puts 450 villages under water
What's causing these problems? Simply put - Population, Affluence Technology. I= PAT. Population continues to grow, as does affluence. Technology, although it creates efficiencies, and less polluting resources, is unable to counteract the growth of the first two.
But nothing lasts forever, and growth can not continue. At some point it will stop. Some folks think it won't stop until we hit the "Venus Syndrome"; others predict a Near Term Extinction for humans.
But I am an optimist!
I like to think that Limits to Growth got it right - that there will merely be a collapse of industrial production, and a population decline. And that this will disrupt the current program of burning everything up as fast as we can. Some humans may even come out on the other side of the bottleneck.
.
Below is an article by Dr Graham Turner, of the University of Melbourne, presenting the conclusion to his recent study updating LTG. . It's worth taking a look at a more detailed explanation found here, which is presentation made to the.Melbourne Sustainability Society. He does a nice job of incorporating Peak oil, and EROI into the analysis. ( For more detail on his methods and data - see his 2008 update here , and his 2012 update here. )
So, lets get right to the punch line. "When will things start looking better?" When will P and A start to fall? Although, the original authors of LTG were quite clear that they were not making predictions, Dr Turner is not as shy.
Lets look at Affluence , as it declines first. . LTG used "per capita industrial output" as a measure of wealth, so we can track that We are already beginning to see problems in the oil area, as it requires more and more and more capital to produce the same amount. This resource limit may be affecting industrial output. Dr. Turner says that growth in per capita industrial output has already begun to decelerate (based on UN data from before the Great Recession). So, Dr Turner says it will peak and begin to decline in the near future, perhaps by 2015. How about population? There is a bit of a lag here. Food growth has slowed, but because of lags, population will continue to grow, and he says it will peak in 2030.
So keep your eye on industrial production. And if things begin to turn, you'll see headlines talking about falling demand. things like IEA slashes demand outlook or OPEC cuts demand outlook. As demand decreases you'll see a drop in oil prices. Like Brent drops to 17 month low.
I still think 2015 is a bit optimistic. But who knows?
Of course this isn't likely to prevent 2 degrees of waming. But if could conceivable stop 3 or 4. If you look at the decline curve for Industrial Output in the LTG Reference Case, you will see a very steep drop off. By 2050, it is an about 1/3 of the peak. (It would be interesting to compare this to the Kevin Anderson graphs)
-------
Four decades after the book was published, Limit to Growth’s forecasts have been vindicated by new Australian research. Expect the early stages of global collapse to start appearing soon
The 1972 book Limits to Growth, which predicted our civilisation would probably collapse some time this century, has been criticised as doomsday fantasy since it was published. Back in 2002, self-styled environmental expert Bjorn Lomborg consigned it to the “dustbin of history”.
It doesn’t belong there. Research from the University of Melbourne has found the book’s forecasts are accurate, 40 years on. If we continue to track in line with the book’s scenario, expect the early stages of global collapse to start appearing soon.
Limits to Growth was commissioned by a think tank called the Club of Rome. Researchers working out of the Massachusetts Institute of Technology, including husband-and-wife team Donella and Dennis Meadows, built a computer model to track the world’s economy and environment. Called World3, this computer model was cutting edge.
The task was very ambitious. The team tracked industrialisation, population, food, use of resources, and pollution. They modelled data up to 1970, then developed a range of scenarios out to 2100, depending on whether humanity took serious action on environmental and resource issues. If that didn’t happen, the model predicted “overshoot and collapse” – in the economy, environment and population – before 2070. This was called the “business-as-usual” scenario.
The book’s central point, much criticised since, is that “the earth is finite” and the quest for unlimited growth in population, material goods etc would eventually lead to a crash.
So were they right? We decided to check in with those scenarios after 40 years. Dr Graham Turner gathered data from the UN (its department of economic and social affairs, Unesco, the food and agriculture organisation, and the UN statistics yearbook). He also checked in with the US national oceanic and atmospheric administration, the BP statistical review, and elsewhere. That data was plotted alongside the Limits to Growth scenarios.
The results show that the world is tracking pretty closely to the Limits to Growth “business-as-usual” scenario. The data doesn’t match up with other scenarios.
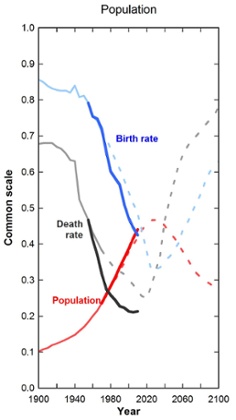
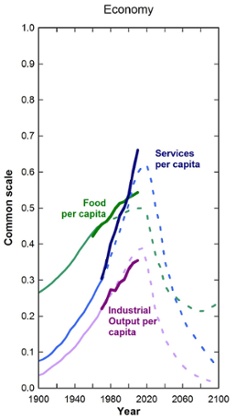
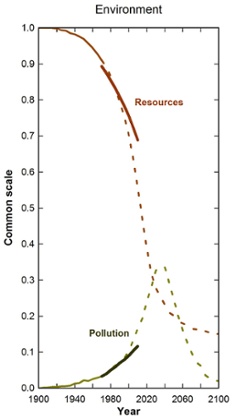
These graphs show real-world data (first from the MIT work, then from our research), plotted in a solid line. The dotted line shows the Limits to Growth “business-as-usual” scenario out to 2100. Up to 2010, the data is strikingly similar to the book’s forecasts.
 Solid line: MIT, with new research in bold. Dotted line: Limits to Growth ‘business-as-usual’ scenario.
 Solid line: MIT, with new research in bold. Dotted line: Limits to Growth ‘business-as-usual’ scenario. Photograph: Supplied
 Solid line: MIT, and research in bold. Dotted line: Limits to Growth ‘business-as-usual’ scenario. Photograph: Supplied
As the MIT researchers explained in 1972, under the scenario, growing population and demands for material wealth would lead to more industrial output and pollution. The graphs show this is indeed happening. Resources are being used up at a rapid rate, pollution is rising, industrial output and food per capita is rising. The population is rising quickly.
So far, Limits to Growth checks out with reality. So what happens next?
According to the book, to feed the continued growth in industrial output there must be ever-increasing use of resources. But resources become more expensive to obtain as they are used up. As more and more capital goes towards resource extraction, industrial output per capita starts to fall – in the book, from about 2015.
As pollution mounts and industrial input into agriculture falls, food production per capita falls. Health and education services are cut back, and that combines to bring about a rise in the death rate from about 2020. Global population begins to fall from about 2030, by about half a billion people per decade. Living conditions fall to levels similar to the early 1900s.
It’s essentially resource constraints that bring about global collapse in the book. However, Limits to Growth does factor in the fallout from increasing pollution, including climate change. The book warned carbon dioxide emissions would have a “climatological effect” via “warming the atmosphere”.
As the graphs show, the University of Melbourne research has not found proof of collapse as of 2010 (although growth has already stalled in some areas). But in Limits to Growth those effects only start to bite around 2015-2030.
The first stages of decline may already have started. The Global Financial Crisis of 2007-08 and ongoing economic malaise may be a harbinger of the fallout from resource constraints. The pursuit of material wealth contributed to unsustainable levels of debt, with suddenly higher prices for food and oil contributing to defaults – and the GFC.
The issue of peak oil is critical. Many independent researchers conclude that “easy” conventional oil production has already peaked. Even the conservative International Energy Agency has warned about peak oil.
Peak oil could be the catalyst for global collapse. Some see new fossil fuel sources like shale oil, tar sands and coal seam gas as saviours, but the issue is how fast these resources can be extracted, for how long, and at what cost. If they soak up too much capital to extract the fallout would be widespread.
Our research does not indicate that collapse of the world economy, environment and population is a certainty. Nor do we claim the future will unfold exactly as the MIT researchers predicted back in 1972. Wars could break out; so could genuine global environmental leadership. Either could dramatically affect the trajectory.
But our findings should sound an alarm bell. It seems unlikely that the quest for ever-increasing growth can continue unchecked to 2100 without causing serious negative effects – and those effects might come sooner than we think.
It may be too late to convince the world’s politicians and wealthy elites to chart a different course. So to the rest of us, maybe it’s time to think about how we protect ourselves as we head into an uncertain future.
As Limits to Growth concluded in 1972:
If the present growth trends in world population, industrialisation, pollution, food production, and resource depletion continue unchanged, the limits to growth on this planet will be reached sometime within the next one hundred years. The most probable result will be a rather sudden and uncontrollable decline in both population and industrial capacity.
So far, there’s little to indicate they got that wrong.
Labels: extinction, Limits to growth, oil, Peak Oil

0 Comments:
Post a Comment
Subscribe to Post Comments [Atom]
<< Home