IEA predicts renewable growth
Greetings
This looks very encouraging. What I don't see, is a prediction of when this build out will have an impact on CO2.
Not until the renewables actualy displace existing coal plants.
Any predictions?
 For Greentech Media this week, I reviewed the new Medium-Term Renewable Energy Market Report 2013 from the International Energy Agency (IEA), and found a surprisingly bullish forecast for renewables, especially wind and solar. Most interesting are the phenomenal growth rates they project for the developing world.


Wind to Double and Solar to Triple in 6 Years, Says IEA
For Greentech Media this week, I reviewed the new Medium-Term Renewable Energy Market Report 2013 from the International Energy Agency (IEA), and found a surprisingly bullish forecast for renewables, especially wind and solar. Most interesting are the phenomenal growth rates they project for the developing world.
And a lot of it will be deployed in developing countries.
The headline summary of the new Medium-Term Renewable Energy Market Report 2013from the International Energy Agency (IEA) has been well reported: Renewables will surpass natural gas for electricity generation globally by 2016, doubling nuclear output and coming in second only to coal in power generation.
Total renewable capacity is expected to grow from 1,580 gigawatts in 2012 to 2,350 GW in 2018, while renewable electricity generation grows from 4,860 terawatt-hours to 6,850 terawatt-hours. Renewable generation will be 50 percent greater over the six-year forecast period than it was over the six years from 2006 to 2012.
It’s a remarkably bullish outlook compared to most forecasts. It’s particularly remarkable for the IEA, whose conservative outlook on renewables has historically lagged behind reality.
But the full report contains even more bullish details, which so far have gone largely unremarked-upon.
From 2012 to 2018, wind generation is expected to more than double globally, from 519 terawatt-hours to 1220 terawatt-hours. Generation from solar PV will more than triple from 100 terawatt-hours to 358 terawatt-hours.
Although starting from a lower level, concentrating solar power (CSP) generation will post even more stunning growth, increasing 567 percent from 6 terawatt-hours annually to 34 terawatt-hours.
World wind capacity will double to 559 gigawatts, with the majority of the growth (57 percent) happening in non-OECD countries. Onshore wind will continue to dominate in absolute terms, with 254.7 gigawatts of new capacity, but offshore wind in the non-OECD will grow the most proportionally, increasing a whopping 20 times over its 2012 capacity, to 8 gigawatts.
In the U.S., solar PV capacity is expected to more than quadruple, from 7.7 gigawatts to 31 gigawatts, and wind capacity is expected to nearly double, from 58.8 gigawatts to 93 gigawatts.
Global solar PV capacity will triple to 308 gigawatts, with 57 percent of new capacity being built in the OECD. But non-OECD countries will take the lead in growth rates over the forecast period as European growth moderates and developing countries, notably China, power ahead. Non-OECD solar capacity is expected to increase more than nine times over 2012 levels, to 101.6 gigawatts.
Source: IEA Medium-Term Renewable Energy Market Report 2013
China’s solar PV capacity additions are expected to overtake European OECD additions this year. “Improved economic attractiveness, reduced barriers for the integration of small-scale capacity and higher government targets” have caused the IEA to sharply raise its estimate for China’s solar PV expansion.
Last year, the agency estimated China would have 35 gigawatts of PV in 2017; now it thinks the Asian giant will have 69 gigawatts by 2018.
Not only will non-hydro renewables grow in scale where their development is already well underway, but they will spread geographically as well. IEA expects the number of countries with at least 100 megawatts of solar PV to increase from 30 in 2012 to 65 in 2018, while 75 countries will have at least 100 megawatts of onshore wind. Most of the countries set to join the 100-megawatt club will be in the non-OECD region.
Source: IEA Medium-Term Renewable Energy Market Report 2013
Even greater growth possible
As bullish as the IEA’s outlook is, it still might not be quite bullish enough.
In the IEA’s view, the combined world wind and solar capacity will more than double from 2012 to 2018, adding just under 500 gigawatts of new capacity in six years. But in its latest report, Navigant Consulting forecasts that global wind and solar capacity will grow by 1,300 gigawatts in the next ten years.
To underscore how significant the growth rates might be in smaller, largely off-the-radar developing nations, consider Chile. IEA expects that nation’s solar capacity to grow from a mere 3.5 megawatts today to 1,100 megawatts in 2018, citing 3.1 gigawatts of solar projects that had received environmental approval from the government as of April 2013, with another 0.8 gigawatts under review.
But the June 2013 report [Portuguese PDF] from the Chilean Center for Renewable Energy (Centro de Energías Renovables) lists 69 megawatts of solar currently under construction, another 4 gigawatts of solar projects approved, and another 2.2 GW under review. Applications for 649 megawatts were submitted in the month of May alone.
Of course, how many of those projects will get built, and when, remains to be seen. But the mere fact that gigawatts’ worth of additional solar projects were approved and taken under review in Chile in just three months suggests that solar could grow much faster than IEA expects in the developing world, particularly in South America. Chile could take out the IEA’s target for 2018 in the next year or two if the country were able to execute projects at North American or European speed.
Competitive without incentives
With this report, IEA joins a number of other agencies in forecasting that onshore wind and solar PV “have reached, or are approaching, competitiveness in a number of markets without generation-based incentives.” While the levelized cost of generation (LCOE) from renewables is generally still higher than that of new fossil-fueled power plants, the claims that renewables are too expensive or that they can’t compete without subsidies will soon be dead and buried. In Spain, Italy, southern Germany, southern California, Australia, Denmark, and certain other market segments, the LCOE of solar PV is already cheaper than retail electricity prices.
However, it’s important to recognize that the competitiveness of renewables is enormously dependent on their specific locations, and on the grid power mix in those areas. For example, the IEA notes that the LCOE of onshore wind is competitive with new gas-fired plants in Brazil, Chile, and Mexico, but not in the U.S., where gas is currently extraordinarily cheap. (If natural gas prices in the U.S. were to return to levels last seen a few years ago, wind would be cheaper.)
In Australia, wind is competitive with new coal- and gas-fired plants with carbon pricing, but only the best wind sites can compete without it. In oil-exporting countries of the Middle East, solar PV is cheaper than burning oil for power generation, because the value of exported oil is so much higher. And so on.
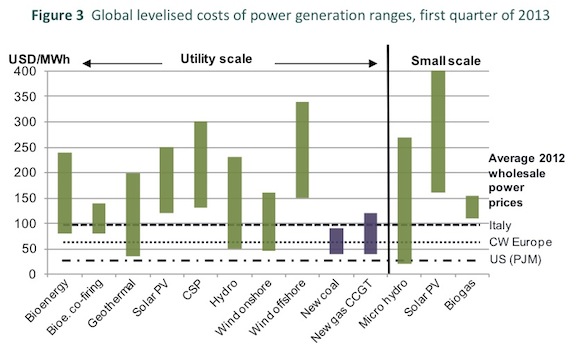
To illustrate this point, consider the IEA’s updated LCOE figures for various power generation technologies:
Source: IEA Medium-Term Renewable Energy Market Report 2013
That chart suggests that the cost of utility-scale solar PV ranges from roughly $125 to $250 per megawatt-hour globally, making it considerably more expensive than new coal- or gas-fired generation. How can that be, when the IEA said that solar PV is competitive with grid power in certain areas?
The answer is that LCOE is a useful way of comparing generation fuels on a global basis, but it doesn’t tell you much about the actual cost of generation from a specific wind or solar farm, where the price of the energy generated is established under a long-term power purchase agreement (PPA).
Richard Caperton, an energy analyst with the Center for American Progress, offered his perspective on LCOE vs. PPA prices.
“LCOE and PPA prices are fundamentally two different things, and it’s a mistake to treat them as substitutes. […] A survey of PPAs is much more useful for information about the market characteristics right now,” said Caperton.
“While LCOE estimates for a worldwide industry aren’t exactly relevant for a project, it is worth keeping in mind that every individual project has an actual cost structure. If the PPA isn’t sufficient to cover that cost structure, you’d better hope you have patient investors, since they won’t ever make any money,” Caperton explained.
Caperton gave this analogy: “Think about the differences in the Case-Shiller Home Price Index and what you actually can expect to pay for a house. The Case-Shiller index is useful for knowing something about broad industry trends, but no one in their right mind would just look at that Index to figure out what to offer on a house. You have to consider the location, the mortgage rates at that time, the condition of the house, and whether or not you’re eligible for any tax incentives. LCOE estimates are like the Case-Shiller Index, but PPAs are what a house actually sells for.”
So, for example, while the IEA’s lowest LCOE for utility-scale solar PV is currently around $125 per megawatt-hour, the actual cost of one new utility-scale solar PV project in New Mexico is just $57.90 per megawatt-hour after the state production tax credit and around $84.90 per megawatt-hour before it, making the project cheaper than the average $128.00 per megawatt-hour for a new coal plant.
If the growth curves of utility-scale wind and solar projects proceed as the IEA expects — or even faster, as they very well may — then the renewable revolution will indeed be “unstoppable.”h
Labels: climate, fossil fuel, renewable energy
posted by Walter @ 2:15 PM
0 Comments
![]()

0 Comments:
Post a Comment
Subscribe to Post Comments [Atom]
<< Home